
Figures & data
Table 1. Analytical framework indicating the dimensions and codes used in data analysis.
Figure 1. Average milk collections across the season and cooling centres.
The dry season were periods of no rains and some cattle moved to other grazing areas away from Dakawa while in the wet season there is more rain and cattle are grazed in Dakawa. Traders signify the different cooling centres aggregating milk from various motorbike riders. Data was collected in August 2020 and the X=axis denotes a recall of milk volumes collected per season across years.
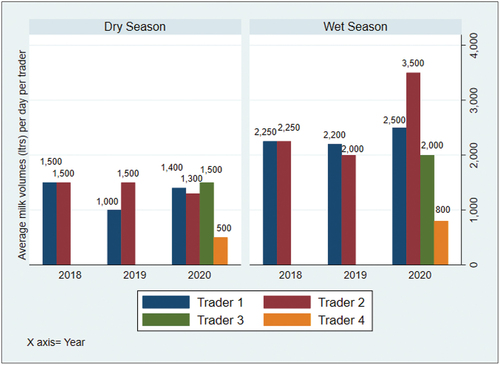
Figure 2. Prices of milk across seasons and cooling centres.
The dry season were periods of no rains and some cattle moved to other grazing areas away from Dakawa while in the wet season there is more rain and cattle are grazed in Dakawa. Data was collected in August 2020.
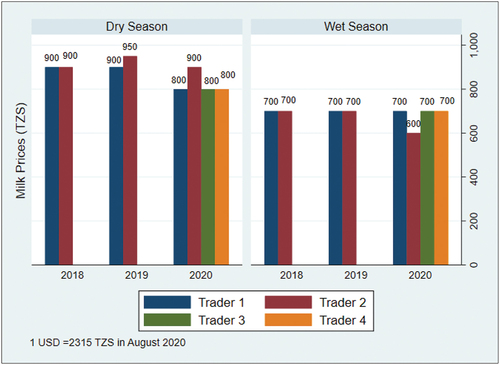
Figure 3. Panel a= shows Dakawa ward and Dumila ward where cattle migrate during dry season. b= shows the location of dakawa within Tanzania and c= shows the various milk cooling centres in Dakawa ward.
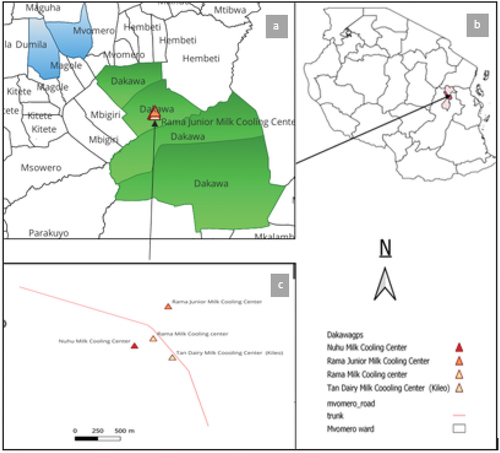
Table 2. Demographic statistics of the pastoralist households.
Table 3. Differences in demographics for pastoralists selling milk and those not selling milk.