
Figures & data
Figure 1. Dynamic changing trend of China’s monetary policy transparency.
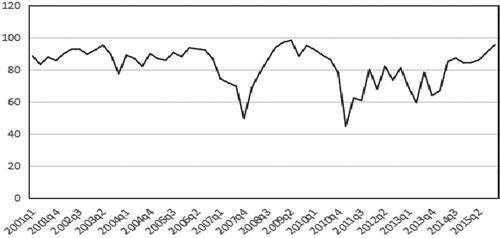
Table 1. Estimated parameter results and effects of 9 models under normal distribution based on national inflation rates.
Table 2. Estimated parameter results and effects of 9 models under t distribution based on national inflation rates.
Figure 2. Changing trends of β ce at double chains.
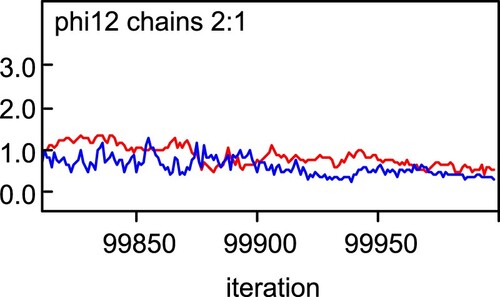
Figure 3. Changing trends of β ce at double chains.
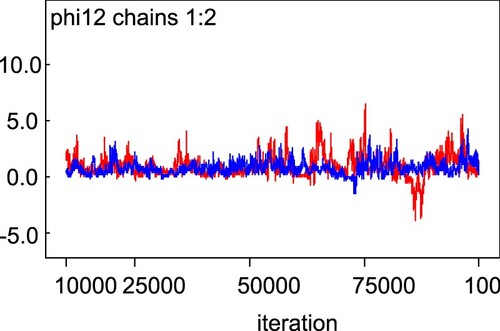
Figure 4. Probabilities of β ce values.
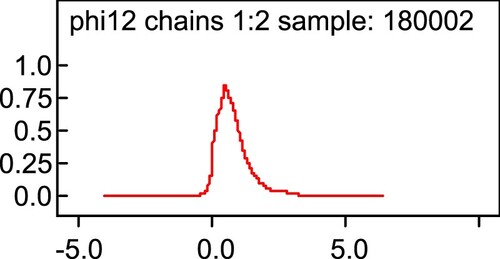
Figure 5. The Gelman-Rubin test of β ce.
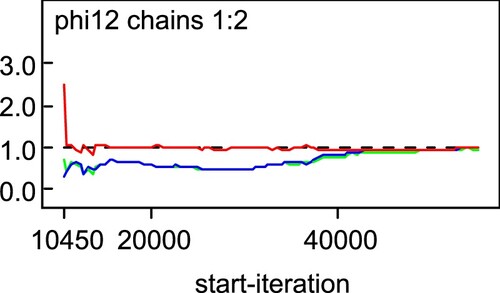
Figure 6. Probabilities of β ce values in model 4a.
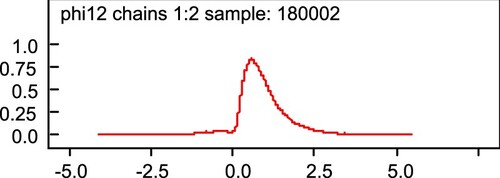
Figure 7. Probabilities of β ce values in model 5a.
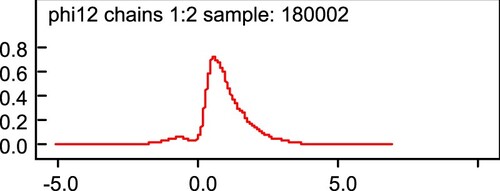
Figure 8. Probabilities of β ce values in model 6.
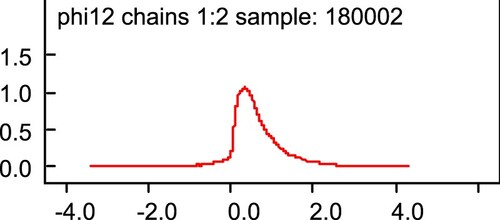
Figure 9. Probabilities of β ce values in model 7.
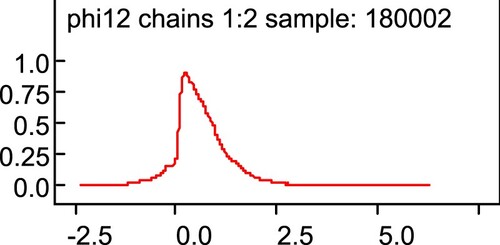
Table 3. Estimated parameter results and effects of 9 models under normal distribution based on urban inflation rates.
Figure 10. Probabilities of β ce values in model 4a.
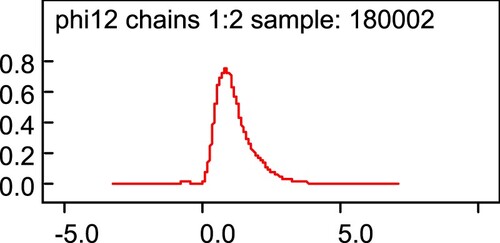
Figure 11. Probabilities of β ce values in model 5a.
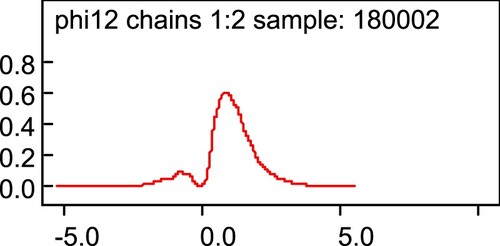
Figure 12. Probabilities of β ce values in model 6.
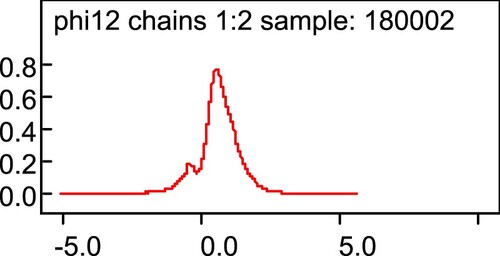
Figure 13. Probabilities of β ce values in model 7.
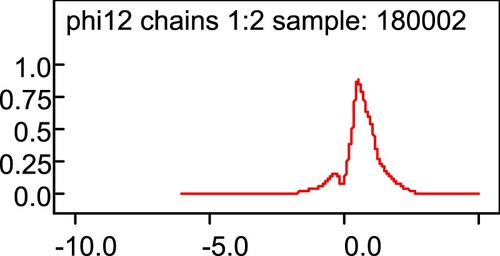
Table 4. Estimated parameter results and effects of 9 models under t distribution based on urban inflation rates.
Figure 14. Probabilities of β ce values in model 4a.
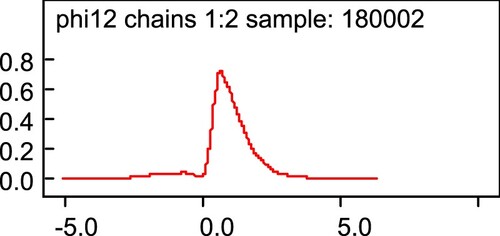
Figure 15. Probabilities of β ce values in model 5a.
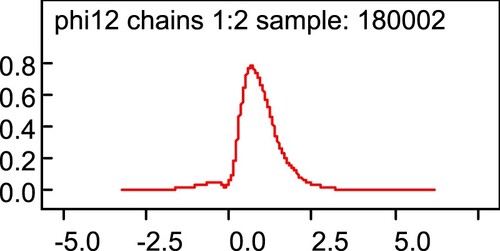
Figure 16. Probabilities of β ce values in model 6.
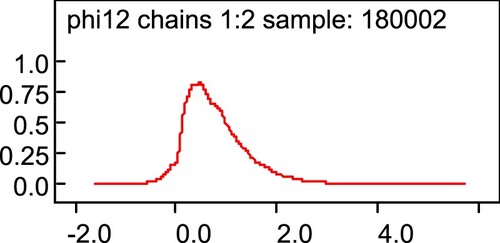
Figure 17. Probabilities of β ce values in model 7.
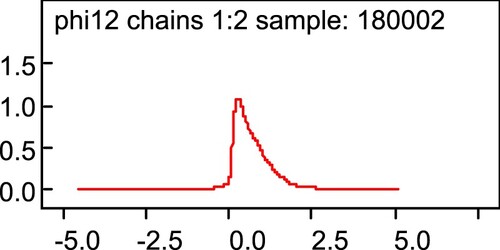
Table 5. Granger causality test results of inflation volatility, inflation expectations volatility, and transparency.
Figure 18. Structural impulse responses of inflation volatility, inflation expectations volatility and transparency.
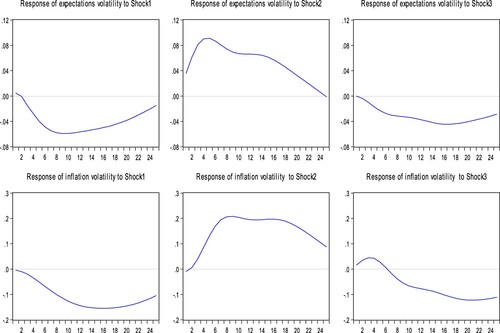
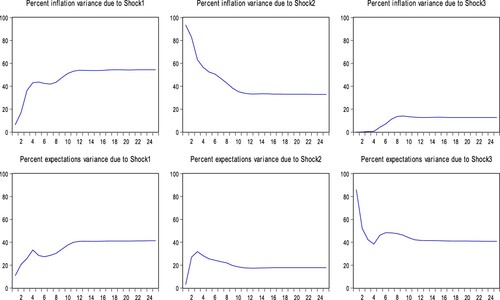
Figure 19 . Structural variance decomposition of inflation volatility, inflation expectations volatility and transparency.
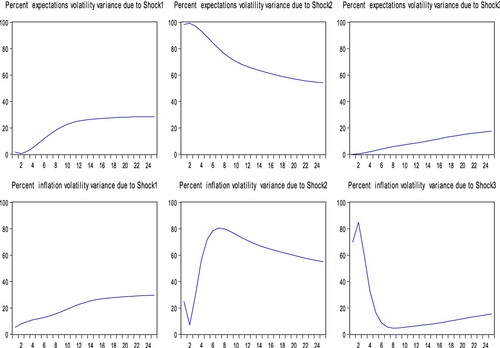
Table 6. Granger causality testing results of inflation volatility, inflation expectations volatility, and transparency.
Figure 20. Impulse responses of inflation volatility, inflation expectations volatility and transparency.
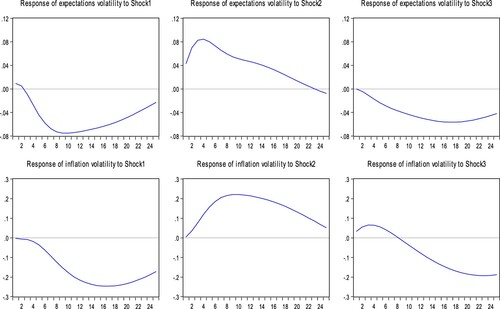
Figure 21. Variance decomposition of inflation volatility, inflation expectations volatility and transparency.
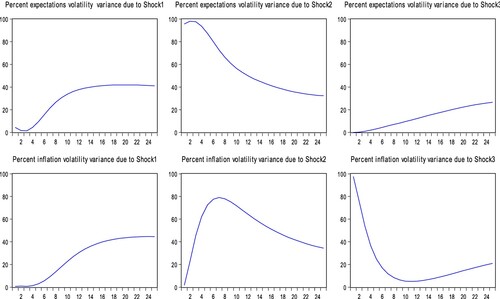
Table 7. Granger causality results of inflation, inflation expectations, and transparency.
Figure 22. Impulse responses of inflation, inflation expectations and transparency.
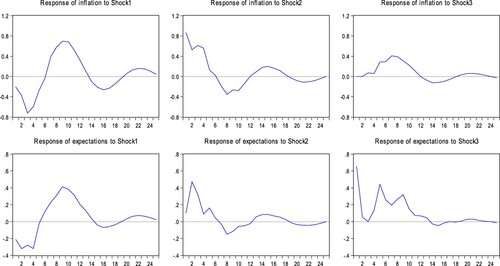
Figure 23. Variance decomposition of inflation, inflation expectations and transparency.
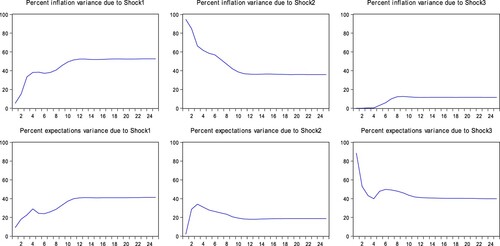
Table 8. Granger causality results of inflation, inflation expectations, and transparency.
Figure 24. Impulse responses of inflation, inflation expectations and transparency.
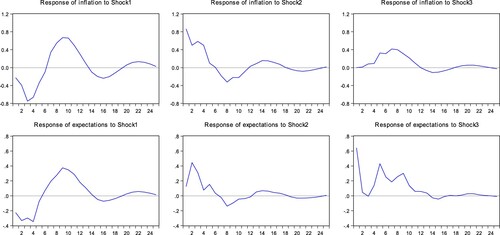
Figure 25. Variance decomposition of inflation, inflation expectations and transparency.
Data availability statement
The data supporting the conclusions of this article are available from the authors, without undue reservation.