Figures & data
Table 1. Discrete-time ADRC scheme parameters.
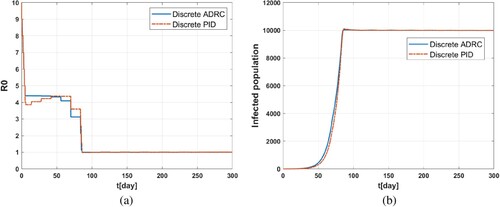
Figure 1. The comparison of the simulation of discrete-time ADRC and PID scheme. Top: the reproduction number input into the SIR-T model. Bottom: the output number of infected individuals
.
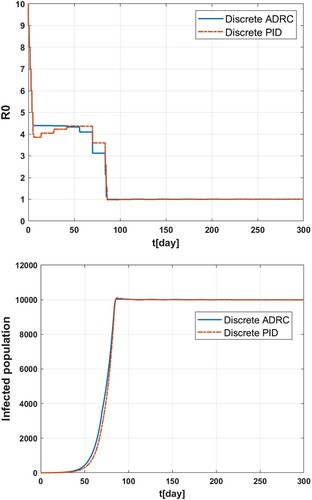
Table 2. Performance indexes for the discrete-time ADRC scheme and the discrete PID scheme.
Figure 2. Simulation results for the two control schemes when the simulation time is 2000 days. (a) The evolution of reproduction number ; (b) the evolution of
; (c) Susceptible individuals
; (d) Infected individuals
; (e) Removed individuals
.
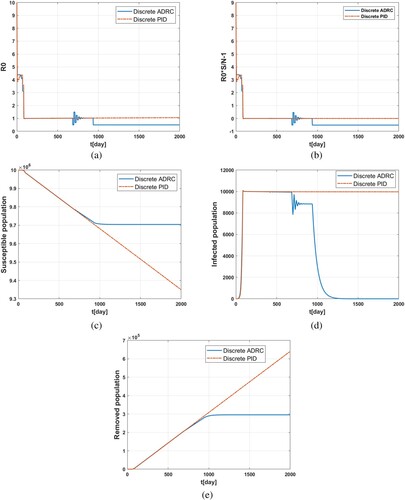
Figure 3. Simulation results for two control schemes when . (a) Input signal: the reproduction number; (b) Output signal: infected individuals
.
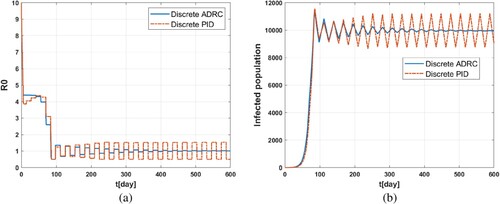
Figure 4. Simulation results for two control schemes when . (a) Input signal: the reproduction number;(b) Output signal: infected individuals
.
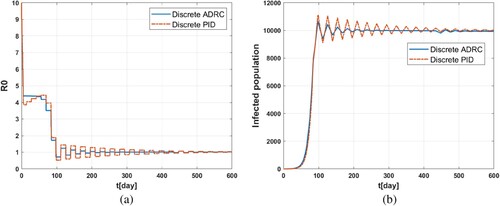
Table 3. Robustness comparison of two control schemes.
Figure 5. Simulation results for two control schemes when . (a) Input signal: the reproduction number; (b) Output signal: infected individuals
.
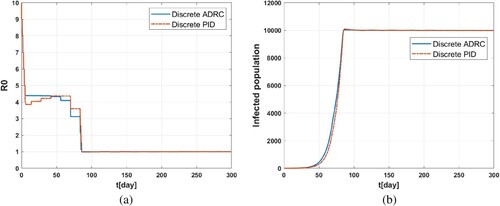
Figure 6. Simulation results for two control schemes when . (a) Input signal: the reproduction number; (b) Output signal: infected individuals
.