
Figures & data
Figure 1. Model problem geometry region.
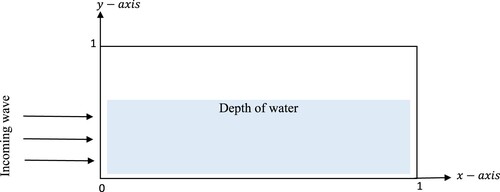
Figure 2. Example 1: Error behaviour in and
norm for N = 20 (left) and N = 30 (right).
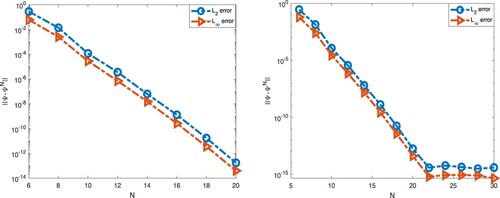
Figure 3. Example 1: Numerical solution (left) vs exact solution (right) at N = 15 .
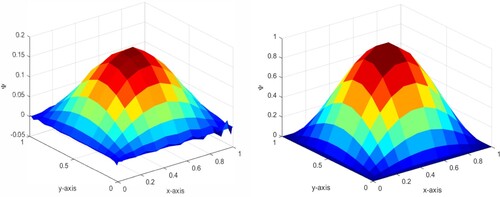
Figure 4. Example 1: Numerical solution (left) vs exact solution (right) at N = 30 .
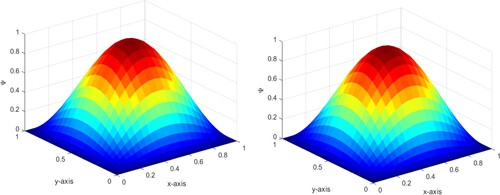
Figure 5. Example 1: Numerical solution (left) vs exact solution (right) at N = 50 .
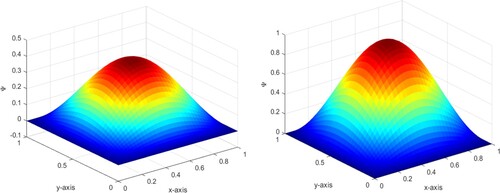
Figure 6. Example 1: Numerical solution (left) vs exact solution (right) at N = 100 .
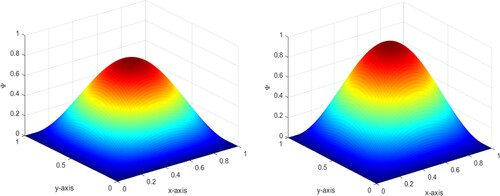
Figure 7. Example 2: Numerical solution (left) vs exact solution (right) at N = 15 .
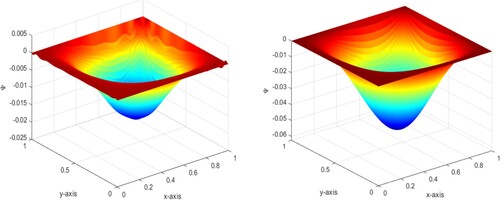
Figure 8. Example 2: Numerical solution (left) vs exact solution (right) at N = 30 .
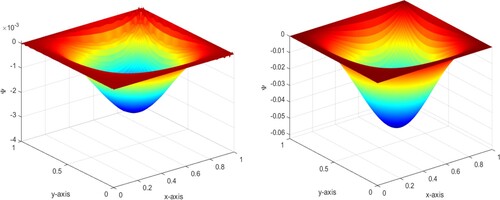
Figure 9. Example 2: Numerical solution (left) vs exact solution (right) at N = 50 .
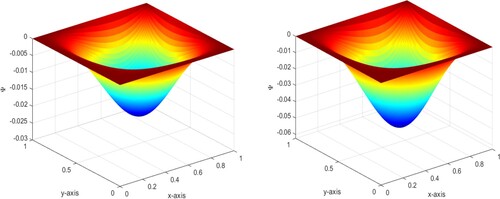
Figure 10. Example 2: Numerical solution (left) vs exact solution (right) at N = 100 .
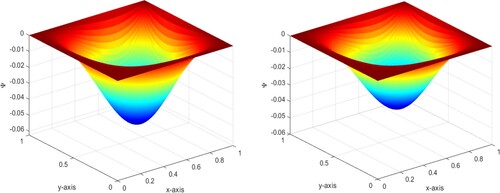
Table 1. Example 2: Error behaviour between exact and numerical solution.
Figure 11. Example 3: Numerical solution (left) vs exact solution (right) at N = 10 .
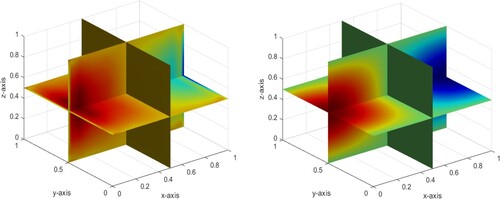
Figure 12. Example 3: Numerical solution (left) vs exact solution (right) at N = 15 .
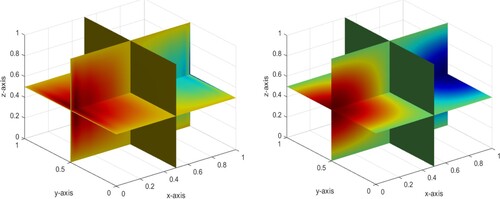
Figure 13. Example 3: Numerical solution (left) vs exact solution (right) at N = 20 .
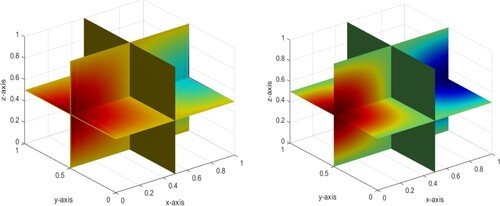
Figure 14. Example 3: Numerical solution (left) vs exact solution (right) at N = 25 .
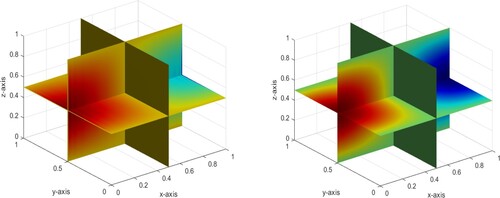
Table 2. Example 3: Error behaviour between exact and numerical solution.