
Figures & data
Figure 1. Comparison of compartment of Cancer dynamical model with two numerical method with integer order and m = 256 with time t = 5 days. (a) Comparison plot of Tumour cells
. (b) Comparison plot of Immune effector cells
and (c) Comparison plot of Immune effector cells
.
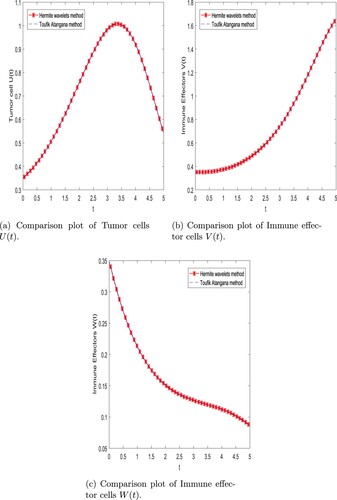
Figure 2. Comparison of compartment of Cancer dynamical model with two numerical method with fractional order and m = 256 with time t = 40 days. (a) Time sequence diagram of Tumour cells
. (b) Time sequence diagram of Immune effector cells
and (c) Time sequence diagram of Immune effector cells
.
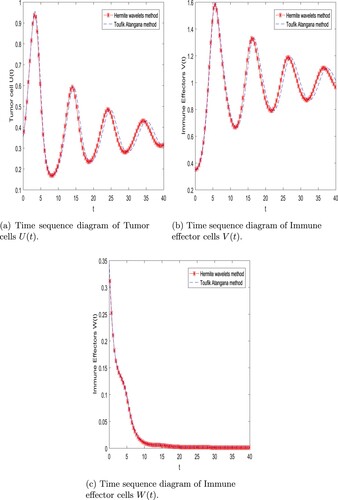
Figure 3. 3D plot of compartment of Cancer dynamical model with Hermite wavelet method with integer order and m = 256. (a) Three-dimensional plot of Tumour cells
. (b) Three-dimensional plot of Immune effector cells
and (c) Three-dimensional plot of Immune effector cells
.
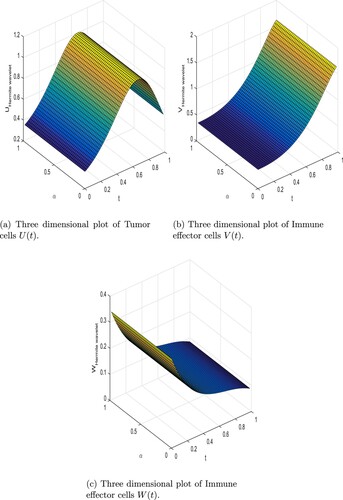
Figure 4. Phase diagram of compartment of Cancer dynamical model with two numerical method with integer order and m = 256 with time t = 5 days. (a) Phase plot of Tumour cells
and cytotoxic T cells
. (b) Phase plot of cytotoxic T cells
and natural killer T cells
and (c) Phase plot of Tumour cells
and natural killer T cells
.
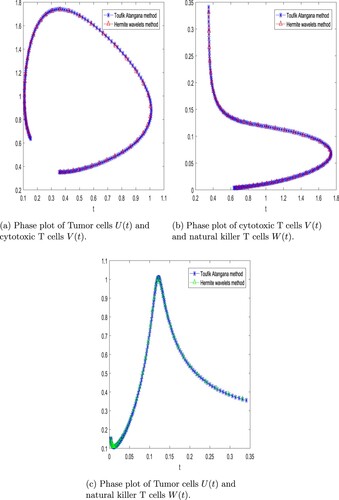
Figure 5. Two-dimensional plot of compartment of Cancer dynamical model with different values of alpha using Hermite wavelet method and m = 256 with time t = 5 days. (a) The graphical behaviour of Tumour cells corresponding to different derivative order α. (b) The graphical behaviour of natural killer T cells corresponding to different derivative order α and (c) The graphical behaviour of cytotoxic T cells corresponding to different derivative order α.
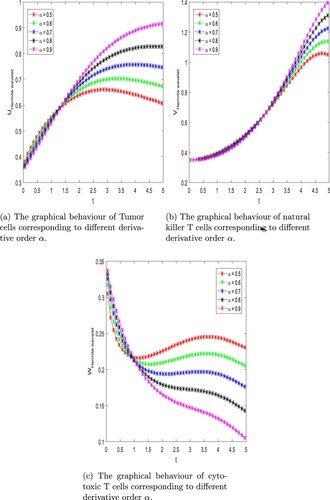
Figure 6. Chaotic phase plot of compartment of Cancer model with Caputo derivative with new numerical scheme with different value of α.
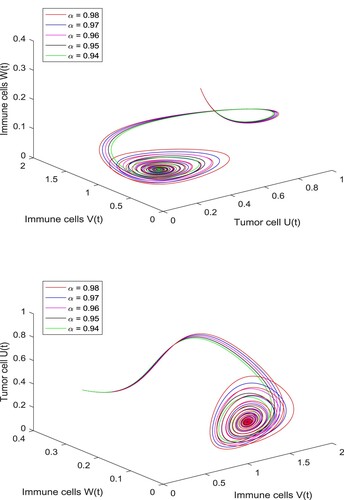
Figure 7. The maximal bifurcation for the Cancer model interpreting Tumour cell versus the parameter
and
. (a) Maximal bifurcation plot of
at
. (b) Maximal bifurcation plot of
at
and (c) Maximal bifurcation plot of
at
.
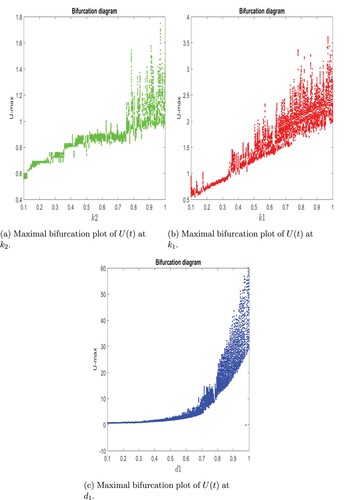
Table 1. Comparison between the Tumour cells and Immune effectors
, Immune effectors
using the Hermite wavelet method (HWM) and Toufik-Atangana method
for m = 256 and
.
Data availability statement
Data available on request from the authors.