Figures & data
Figure 1. Summary of autophagosome formation. (A) Under nutrient-rich conditions (high abundance of amino acids, growth factors, and a high ATP:AMP ratio), cell growth signals converge to activate mTOR. The activation of mTOR phosphorylates ULK1 complex and deactivates it, resulting in the inhibition of autophagy. (B) Under nutrient-deprived conditions, mTOR activity is suppressed. Inhibition of mTOR prevents phosphorylation of ULK1 complex which activates autophagy. Activated ULK1, along with ATG13, phosphorylate downstream PtdIns3K complex subunits, like BECN1 and AMBRA1. The activation of autophagy dissociates BECN1 from BCL-2, freeing BCL-2 to prevent apoptosis and allow BECN1 to join AMBRA1 and the rest of the PtdIns3K complex located at the microtubule network. The phosphorylation of AMBRA1 frees the entire PtdIns3K complex from dynein motor unit at the microtubule network to allow translocation to the ER. Once at the ER, the PtdIns3K complex produces PtdIns3P that initiates the nucleation of a PG. Then, the ATG5-ATG12-ATG16L1 complex associates and attaches to the PG as the PG elongates to form an autophagosome. The ATG5-ATG12-ATG16L1 complex then recruits the binding of LC3-II to both the outer and inner membranes of the autophagosome. Processing of LC3 via ATG proteins and lipidation with PE on the autophagosome membranes transform LC3 into LC3-I then LC3-II upon lipidation. LC3-II proteins on the inner membrane recruit proteins like p62 and NBR1 that are attached to ubiquitinated proteins to bring in autophagosome contents. As contents are directed into the PG, elongation of the membrane eventually seals the membrane and creates an autophagosome. Created with BioRender.com.
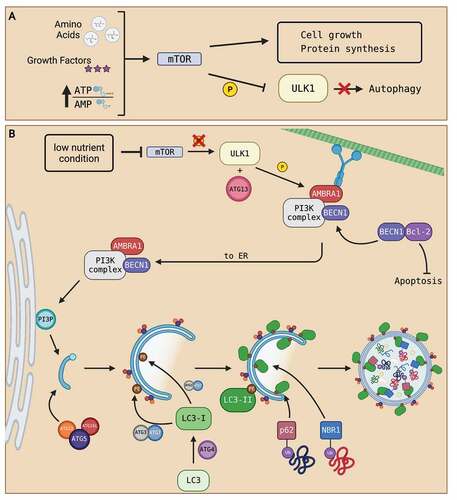
Figure 2. Summary of autophagosome maturation and degradation. (A) After autophagosome formation, the autophagosome is transported from the ER to the lysosome for maturation into an autolysosome. An autophagosome is transported through the cell via the microtubule network with a dynein motor protein. The autophagosome is first fused with an early endosome. Then, the autophagosome is transported towards the lysosome as Rab7 GTPase on the lysosome recruits the dynein protein. When the autophagosome is in near proximity to the lysosome, Rab7 GTPase localizes to the HOPS complex and recruits SNARE proteins to attach the autophagosome with the lysosome. After attachment, hydrolysis of the GTP to GDP on the Rab7 GTPase provides energy for the fusion of autophagosome and lysosome, creating an autolysosome. (B) After the fusion event, autophagosome contents are degraded into monomeric units by lysosomal enzymes. The monomeric units are then transported out of the autolysosome via transporters like LYAAT-1. The monomeric units released into the cytosol are then reused for other cellular functions, like protein production, membrane formation, and cell maintenance. Created with BioRender.com.
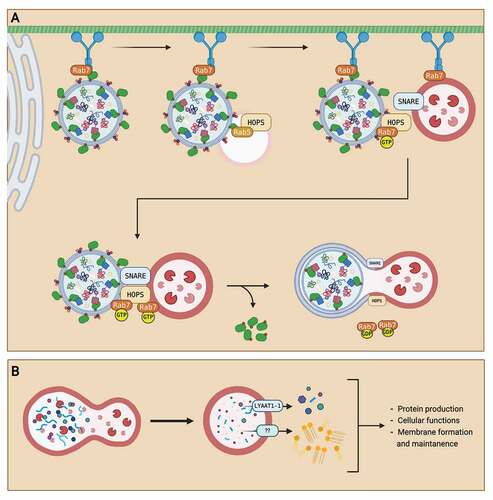
Figure 3. Preimplantation embryo morphology after exposure to autophagy inhibitor. Prolonged exposure to an autophagy inhibitor halts autophagy at early cleavage stages, ultimately leading to developmental arrest. Two-cell mouse embryos were exposed to 75 µM of chloroquine (CQ) treatment for 14 and 48 hours. No CQ treatment was included in the control condition. Black arrowheads indicate preimplantation embryos that were arrested at the 2- and 4- cell stages. White arrowheads indicate preimplantation embryos that were developmentally regressed. Created with BioRender.com. (Image courtesy of Zuleika C. L. Leung).
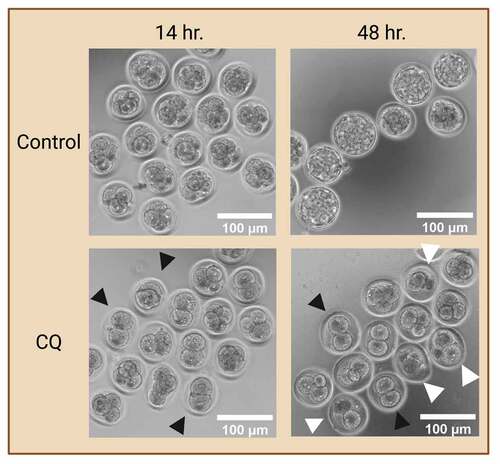
Figure 4. LC3 puncta count to access autophagy in preimplantation embryos. Workflow of analyzing LC3 puncta abundance to reflect autophagy levels in preimplantation embryos (A). Preimplantation mouse embryos were immunofluorescence-stained for LC3 puncta and counterstained with DAPI for cell nuclei. The whole embryo was captured on a confocal microscope; then LC3 puncta (top) was counted, and cell number (bottom) was identified. LC3 puncta count can be normalized to the cell number to present accumulation in a per-cell basis. Autophagic flux assay enables the evaluation of autophagic changes in preimplantation embryos with the use of an autophagy inhibitor (B). One example of an autophagy inhibitor is chloroquine (CQ), which inhibits autophagosome degradation by neutralizing hydrolytic enzymes in the lysosomes. Mouse preimplantation embryos were cultured for 40 hours, then treated with 75 µM of CQ for 30 mins prior to fixation. Note that treatment with CQ resulted in the accumulation of LC3 puncta (green), which reveals the buildup of autophagosomes in the preimplantation embryos after halting autophagosome degradation. An example bar graph shows the expected results of LC3 puncta accumulation per cell in inhibitor-treated vs. non-inhibited control embryos (p<0.05). No CQ treatment was included in the control condition. The difference in LC3 puncta count per cell between these groups reveals the changes in the rate of autophagosome formation and degradation. Scale bars = 100 µm. Created with BioRender.com. (Image courtesy of Zuleika C. L. Leung)
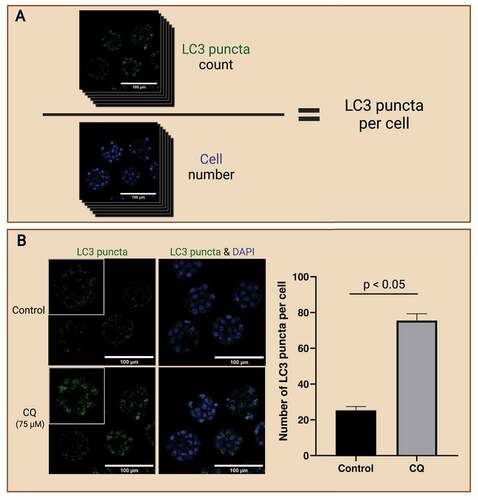
Figure 5. Western blot analysis of LC3-I and LC3-II protein expression to monitor autophagy. Mouse preimplantation embryos were cultured to the blastocyst stage and separated via electrophoresis with various numbers of blastocyst per lane. Western blot analyses of LC3-I and LC3-II were carried out to determine the minimum number of blastocysts required to achieve LC3 abundance at a detectable level. R1 wild-type mouse ES cells pool was included as a control. It was determined that a minimum of 50 blastocysts is required (A). An example of western blot of LC3-I and LC3-II after chloroquine (CQ) treatment (B). Mouse preimplantation embryos were cultured for 48 hours, then treated with 20 µM of CQ for 30 mins prior to fixation. Note that treatment with CQ resulted in a greater abundance of LC3-II (14 kDa) compared to control embryos, which reveals the buildup of autophagosomes in the preimplantation embryos after halting autophagosome degradation. The difference in LC3-II abundance between groups reflects autophagic flux that can be easily compared by densitometry analysis. No CQ treatment was included in the control condition. LC3-I (16 kDa); LC3-II (14 kDa); and β-actin (45 kDa; loading control) are shown. Created with BioRender.com. (Data courtesy of Zuleika C. L. Leung).
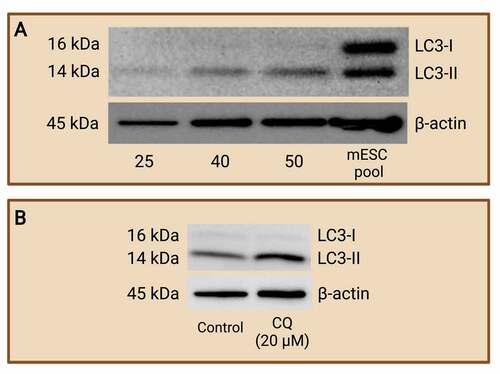
Figure 6. The use of LC3-monitoring probes in evaluating autophagy in preimplantation embryos. Probes of LC3 followed by green fluorescence protein (GFP) are generated (A) and introduced into preimplantation embryos as an internal reporter for autophagic activity (B). mRNA probe of GFP-LC3 is microinjected into embryos to monitor autophagy levels in preimplantation embryos. When preimplantation embryos activate autophagic mechanisms, GFP-tagged LC3 will be translated and incorporated into autophagosomes, allowing the detection of autophagy levels at various cell stages (left). DNA probe of GFP-LC3 is microinjected into embryos to create transgenic mice. Embryos expressing the GFP-LC3 probes can be transferred into pseudopregnant mice to create transgenic animal models which readily express GFP-LC3 (right). Similar to GFP-LC3 probes, the GFP-LC3-RFP-LC3∆G probe contains a GFP-tagged LC3, except that an RFP-LC3∆G sequence immediately follows to translate a red fluorescence protein (RFP)-tagged LC3 with modification to its C-terminal glycine subunit (C). The GFP-LC3-RFP-LC3∆G probe can be introduced to preimplantation embryos by microinjection at the zygotic stage. Both GRP-LC3 and RFP-LC3∆G are co-translated (D). GFP-LC3 is expressed with green fluorescence and participates in autophagy. In contrast, RFP-LC3∆G remains in the cytosol due to the modification to the LC3 protein. This GFP-LC3-RFP-LC3∆G probe enables the evaluation of each step of the autophagy pathway by measuring the GFP and RFP expression. Analysis of the ratio of RFP:GFP reflects the turnover of autophagosomes, in which the increase of RFP:GFP (by decreasing GFP) ratio is indicative of autophagy induction (E). Created with BioRender.com.
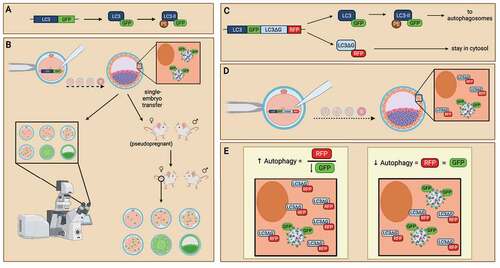
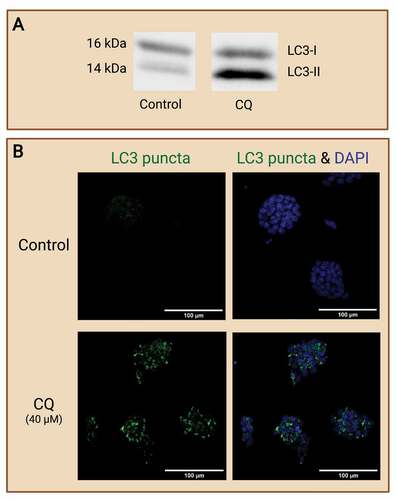
Figure 7. Evaluating autophagy in embryo-derived stem cell lines. Embryo-derived cell lines like embryonic stem (ES) cells and trophoblast stem (TS) cells are great models for evaluating autophagy in preimplantation embryos. ES cells and TS cells are derived from the ICM and trophoblast, respectively, from a developing blastocyst. These cell lines retain the typical expression of their original cell source and can thus provide potential avenues for focused investigation of embryonic cell type-specific effects. (A) Example of Western blot which shows changes of autophagy in wild-type mouse ES cells (R1 line; courtesy of Andras Nagy, Toronto), as reflected by the autophagic marker LC3-II (14 kDa), in response to chloroquine (CQ) treatment. No CQ treatment was included in the control condition. (B) Example images of IF staining of mouse ES cells to detect changes in LC3 puncta after CQ treatment. Note that treatment with CQ resulted in the accumulation of LC3 puncta (green), which reveals the buildup of autophagosomes in the ES cells after halting autophagosome degradation. No CQ treatment was included in the control condition. Scale bars = 100 µm. Created with BioRender.com. (Data and image courtesy of Hailey L. M. Hunter).