
Figures & data
Figure 1. Metabolic pathways involved in endogenous and exogenous ketosis. Endogenous ketosis increases lipolysis, classical hepatic ketogenesis, hyperketonemia and ketone oxidation. Exogenous ketosis with BH-BD consumption, as either a ready to drink beverage or a powder, involves intestinal hydrolysis of BH-BD, classical and non-classical hepatic ketogenesis, hyperketonemia and ketone oxidation. Abbreviations: BHB, beta-hydroxybutyrate; BH-BD, bis hexanoyl (R)-1,3-butanediol. Modifed from Crabtree et al. (Citation11) and created using BioRender.com.
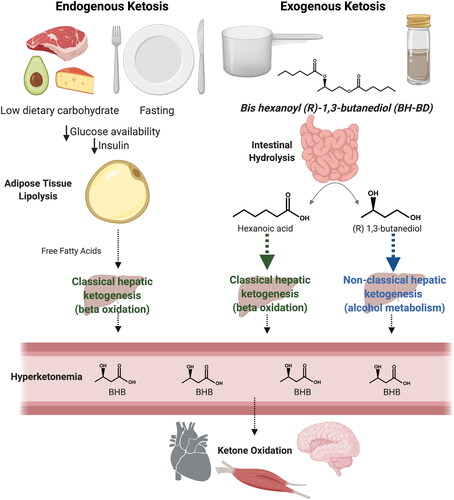
Figure 2. Schematic showing overall study design and test day design.
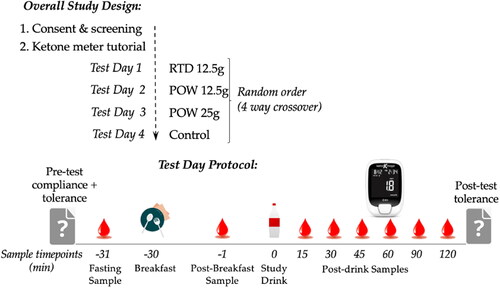
Table 1. Nutritional information of study beverage and standard meal.
Table 2. Baseline characteristics of study participants.
Figure 3. Capillary blood BHB and glucose concentrations in healthy adults (n = 15) following consumption of 25 g or 12.5 g of BH-BD as powder, 12.5 g RTD beverage formulation, or a control drink. A: mean blood BHB concentrations over time, B: peak BHB concentration for each subject normalized to each individual’s baseline value, C: normalized BHB AUC, D: mean glucose concentrations over time, E: minimal normalized glucose concentration for each individual.
Abbreviations: AUC, area under the curve; BHB, beta hydroxybutyrate; BH-BD, bis hexanoyl (R)-1,3-butanediol; Cmax, peak concentration; Cmin, minimal concentration. Data are mean ± standard deviation. * = p <0.05 between group, ** = p <0.001, *** = p <0.0001 between group, NS = not significant; † = p <0.05 between control and POW 25 g groups.
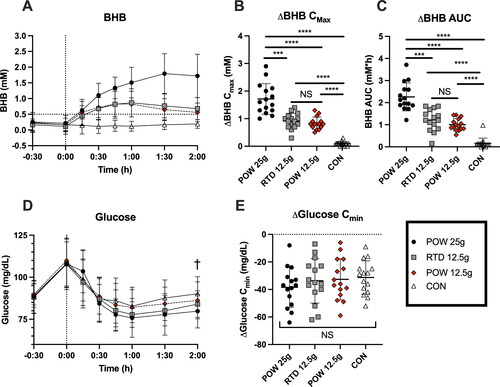
Table 3. Post-product composite beverage tolerability score.
Data availability statement
The data presented here may be available upon reasonable request from the corresponding author and in accordance with intellectual property considerations.