
Figures & data
Figure 1. Study design.
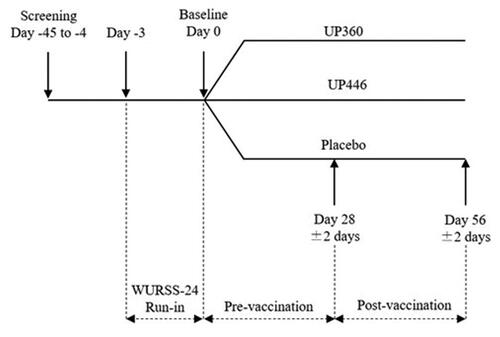
Table 1. Baseline demographic characteristics for participants in the intent-to-treat (ITT) population (n = 50).
Figure 2. Disposition of study participants.
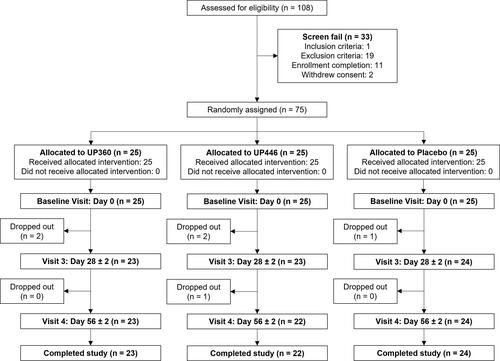
Figure 3. Change in total (A) IgA, (B) IgG, and (C) IgM concentrations between UP446 and Placebo in the pre-vaccination period (baseline to Day 28), post-vaccination period (Day 28 to Day 56) and from baseline to end-of-study (EOS, Day 56) in the ITT population (n = 50). All values presented are mean ± standard deviation (SD). * indicates a significant within-group difference at the specific timepoint and ** indicates a significant difference between UP446 and Placebo.
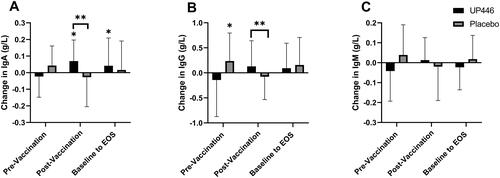
Figure 4. Change in influenza A-specific (A) IgA, (B) IgG, and (C) IgM concentrations between UP446 and Placebo in the pre-vaccination period (baseline to Day 28), post-vaccination period (Day 28 to Day 56) and from baseline to end-of-study (EOS, Day 56) in the ITT population (n = 50). All values presented are mean ± standard deviation (SD). * indicates a significant within-group difference at the specific timepoint.
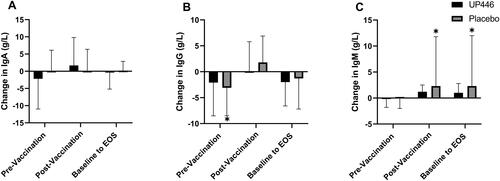
Figure 5. Change in influenza B-specific (A) IgA, (B) IgG, and (C) IgM concentrations between UP446 and Placebo in the pre-vaccination period (baseline to Day 28), post-vaccination period (Day 28 to Day 56) and from baseline to end-of-study (EOS, Day 56) in the ITT population (n = 50). All values presented are mean ± standard deviation (SD). * indicates a significant within-group difference at the specific timepoint.
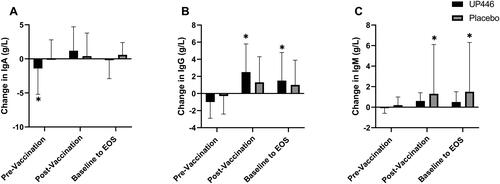
Table 2. Immune cell phenotypes in blood of participants in the ITT population (n = 50).
Table 3. Serum concentrations of antioxidant and oxidative stress markers in participants in the ITT population (n = 50).
Table 4. Upper respiratory tract infection (URTI) symptom severity, well and sick days from the Modified Wisconsin Upper Respiratory Symptom Survey (WURSS)-24 in the ITT population (n = 50).
Table 5. URTI symptom severity, well and sick days from the Modified WURSS-24 in the per protocol (PP) population (n = 46).
Supplemental Material
Download MS Word (79.8 KB)Data availability statement
The datasets used and/or analyzed during the current study are available from the corresponding author on reasonable request.