
Figures & data
Figure 1. Mg-Si-O rock and powder.
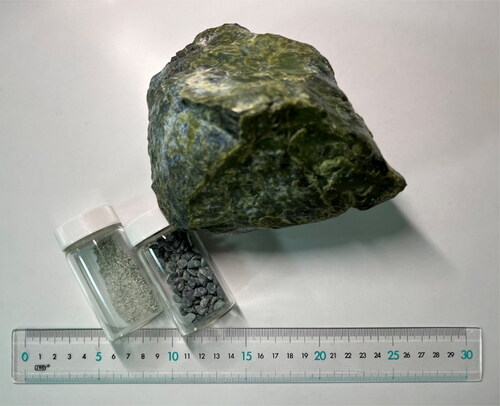
Figure 2. Raw powder and composition analysis.
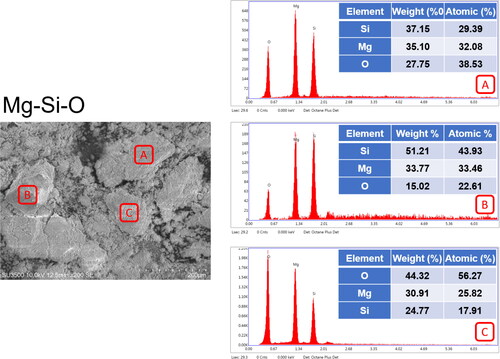
Figure 3. Morphological characteristics of the powders: (a) Mg-Si-O, (b) Mg-Si-Zn-O-MW, (c) Mg-Si-Zn-O-HT.
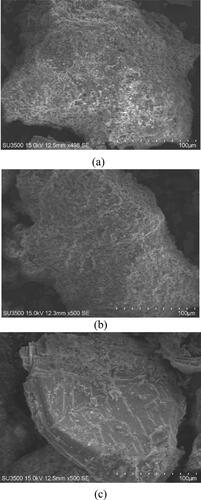
Figure 4. Sintered powder and composition analysis.
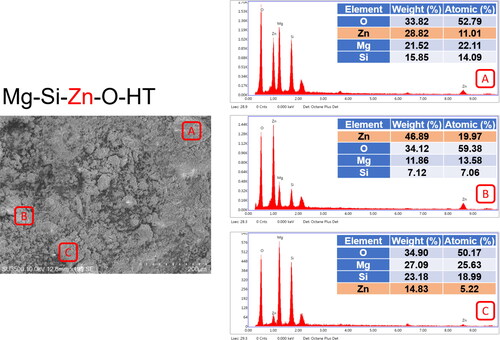
Table 1. Ion release rates of the raw, microwaved, and sintered powders (water temperature: 60 °C).
Table 2. Specific surface area (SSA) of the raw, microwaved, and sintered powders.
Figure 5. XRD data of the different powders.
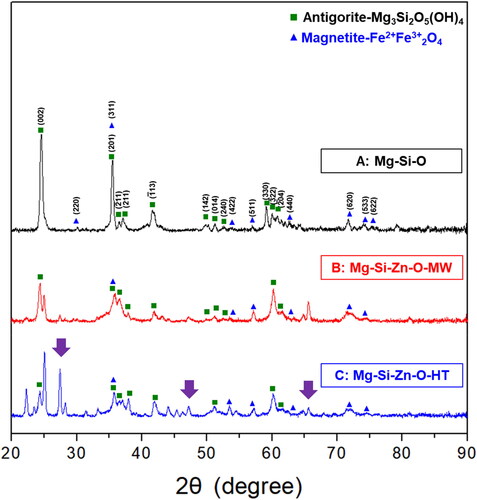
Figure 6. FTIR data of the 3 powders: (a) Mg-Si-O, (b) Mg-Si-Zn-O-MW, (c) Mg-Si-Zn-O-HT, (d) overlapped.
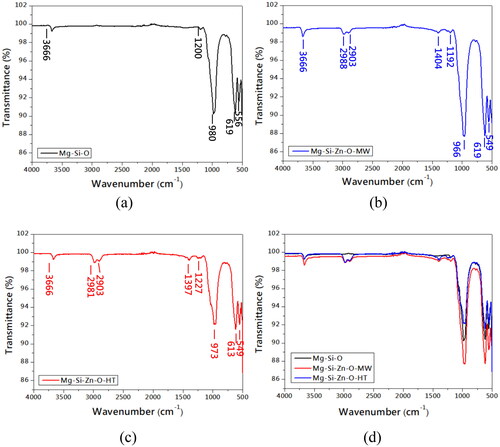
Figure 7. Raman spectroscopy results: (a) Mg-Si-O, (b) Mg-Si-Zn-O-MW, (c) Mg-Si-Zn-O-HT.
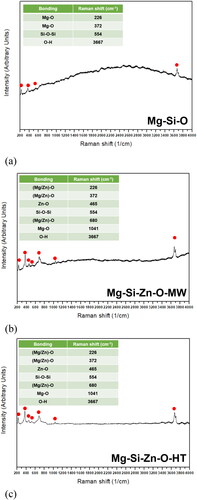
Figure 8. PL spectroscopy results: (a) Mg-Si-O, (b) Mg-Si-Zn-O-MW, (c) Mg- Si-Zn-O-HT, (d) overlapped (325–750nm).
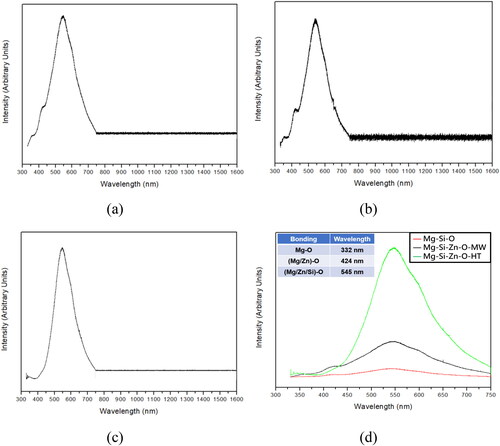
Table 3. Organic soil composition analysis (by ICP) and pH values.
Figure 9. Fresh garlic cloves (left: unenriched garlic, right: enriched garlic). (a) Unprocessed and (b) after peeling.
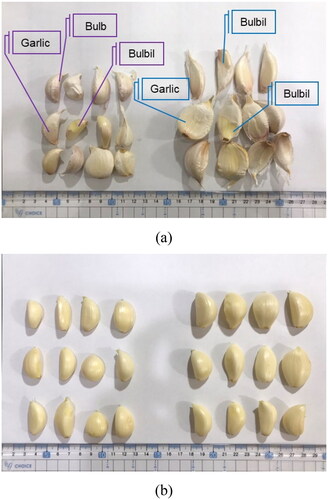
Table 4. Magnesium and zinc ion concentration and composition of the garlic extracts.
Figure 10. Chopped fresh garlic. (a) Unenriched and (b) enriched garlic.
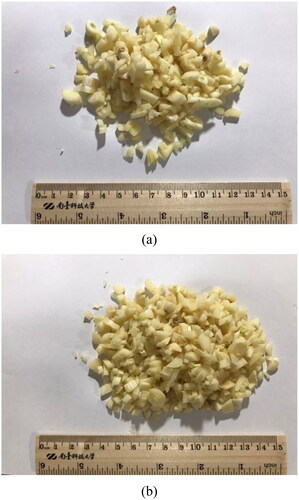
Figure 11. Garlic fermentation (left: unenriched garlic, right: enriched garlic).
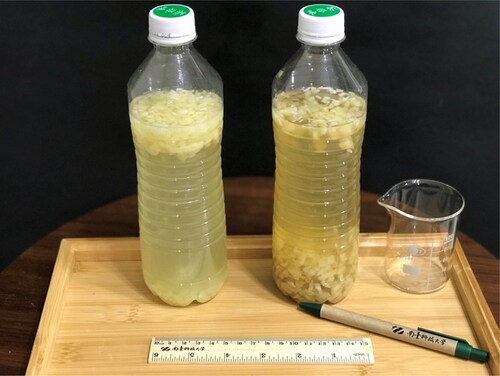
Figure 12. Filtered garlic fermentation solution and remaining garlic cloves (left: unenriched garlic, right: enriched garlic.
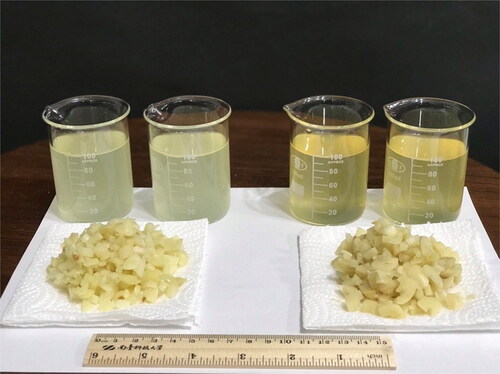
Table 5. Enzyme activity and concentration analysis.