
Figures & data
Table 1. The inclusion and exclusion criteria of this study.
Figure 1. Lateral and posterior-anterior (PA) cephalometric landmarks and planes. (a) S, sella; N, Nasion; Po, porion; Or, orbitale; A, subspinale; B, supramentale; U1, incisal edge of upper first incisor; L1, incisal edge of lower first incisor; Me, menton; FH plane, Frankfort horizontal plane; Mandibular plane, tangent line of the lower border of the mandible. (b) Lo (‘), right and left Latero-orbitale; Mo (‘), right and left side of the intersection of the maxillary bone and the maxillary first molar.
Figure 2. Three-dimensional motion capture system for orofacial soft tissue. (a) Two cameras were mounted opposite the participants’ faces. The remaining four cameras were divided into two on each side of the participant and mounted symmetrically at 45° from the participant’s midline. The two cameras at each angle were 70 cm away from the participant’s head and were higher and lower than the patient’s head. The vertical distance between the two cameras at each angle was 35 cm. (b) Facial landmarks were used for the dynamic analysis.
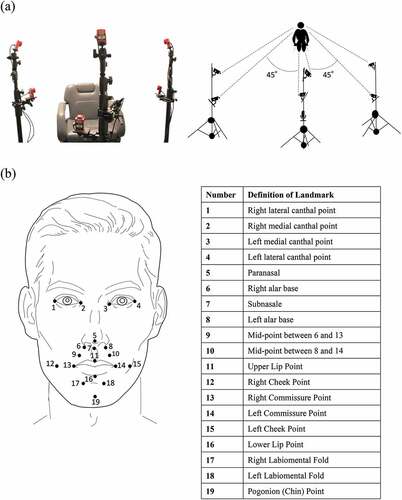
Figure 3. Design of the speech task. The participants repeated the pronunciations series three times. Each session in an alternating pattern consisted of six rest blocks and five speech blocks. The rest block was 3 seconds in duration.
Figure 4. Reference planes in the 3D coordinate system and waveforms representing the motion of each landmark.
Table 2. Descriptive values and statistical calculations for cephalometric variables and irregularity index between each group.
Table 3. Comparison of the maximum displacement of landmarks during /apa/ articulation between the three groups
Table 4. Comparison of the maximum displacement of landmarks /ipi/ articulation between the three groups
Table 5. Comparison of the maximum displacement of landmarks during /upu/ articulation between the three groups
Table 6. Comparison of the maximum displacement of landmarks during /epe/ articulation between the three groups
Table 7. Comparison of the range of movement of landmarks during /opo/ articulation between the three groups
Table 8. Comparison of the asymmetry index (AI) during each sound articulation between the three groups
Figure 5. Correlation between the menton deviations and the asymmetry index (AI) of the two commissure points in the facial deformity patients (SFD and AFD groups).
Data availability statement
The datasets used and analyzed during the current study are available from the corresponding author, KM, upon reasonable request.