Figures & data
Figure 1. Schematic drawings at 0 days (blue in a, b) and 14 days (red in a) after experimental tooth movement of the first molar tooth. A nickel-titanium wire with 0.012-inch diameter moves the first molar tooth to the palatal side (a). Panel b shows the cross section of the palatal root (R) in the first molar tooth with experimental tooth movement. The closed arrow indicates the direction of the force by the nickel-titanium wire. Buccal and palatal regions in the periodontal ligament (PDL) were analysed as tension (TA) and compression areas (CA), respectively. AB; alveolar bone.
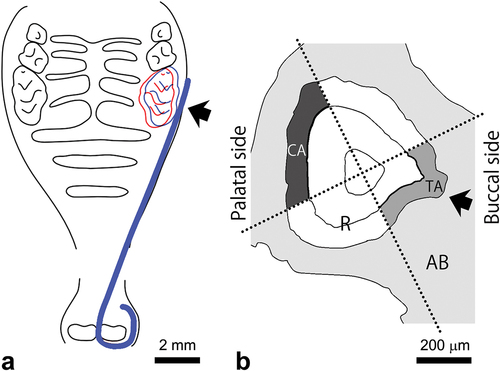
Figure 2. Microphotographs of haematoxylin-eosin-stained sections in the intact periodontal ligament (PDL) (a, b) and the PDL on days 1 (c, d), 3 (e, f), 5 (g, h), 7 (i, j), and 14 (k, l) after initiating tooth movement. After 5 days, compressed and stretched PDL fibroblasts are detectable in the compression (g) and tension (h) areas, respectively. Furthermore, some resorption lacunae (RL) are present in the compression area. After 14 days, no remarkable morphological changes to the PDL are observed. Arrowheads in g indicate large cells in the RL. R; root, AB; alveolar bone. Scale bar = 50 μm (a). All panels are at the same magnification.
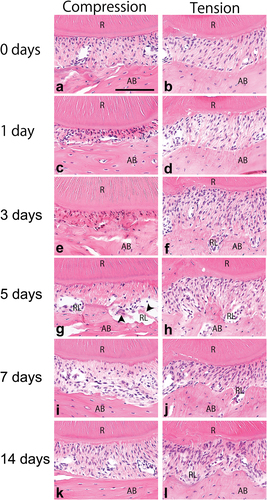
Figure 3. Line graphs illustrating the periodontal ligament (PDL) thickness (a) and the number of large cells with multiple nuclei (b) in the intact PDL (day 0) and the PDL after 1, 3, 5, 7, and 14 days of tooth movement (four mice per stage).
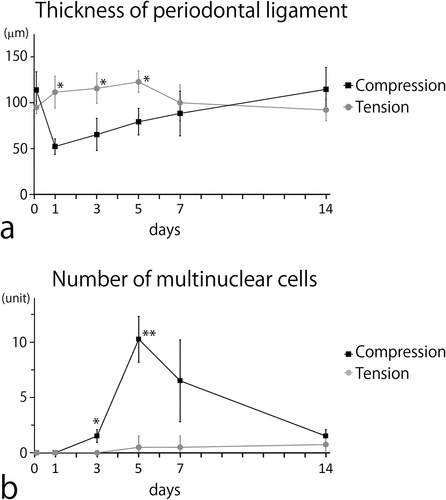
Figure 4. Microphotographs of sodium voltage-gated channel beta subunit 3 (SCN3B) in the intact periodontal ligament (PDL) (a, d) and the PDL after 1 (b, e), 3 (c, f), 5 (g, j), 7 (h, k), and 14 (i, l) days of the tooth movement. The intact PDL (day 0) has a few SCN3B-immunoreactive (IR) nerve fibres, whereas many nerve fibres are detected within the resorption lacuna (RL) in the compression area on day 5. The number of SCN3B-IR nerve fibres decreases 14 days after the tooth movement. R; root, AB; alveolar bone. Scale bar = 50 μm (a). All panels are at the same magnification.
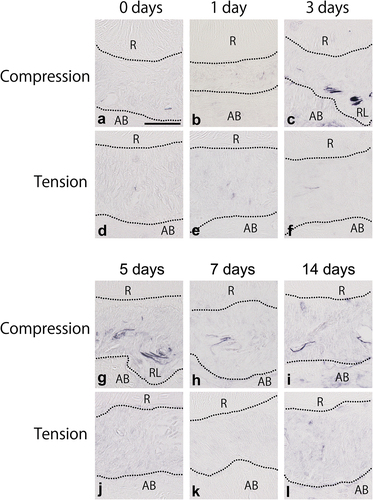
Figure 5. Microphotographs of sodium voltage-gated channel alpha subunit 7 (SCN7A) in the intact periodontal ligament (PDL) (a, d) and the PDL after 1 (b, e), 3 (c, f), 5 (g, j), 7 (h, k), and 14 (i, l) days of tooth movement. The intact PDL (day 0) has many nerve fibres on the palatal side but few on the buccal side (a). After the tooth movement, SCN7A-immunoreactive (IR) nerve fibres decrease in the compression area (b, c, g-i). The distributions of SCN7A-IR nerve fibres in the compression and tension areas are similar on days 5 and 7 after tooth movement. R; root, AB; alveolar bone. Scale bar = 50 μm (a). All panels are at the same magnification.
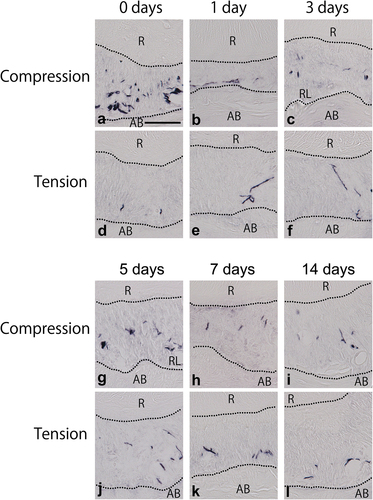
Figure 6. Line graphs showing the distribution of sodium voltage-gated channel beta subunit 3-immunoreactive (SCN3B-IR) (a) and alpha subunit 7-immunoreactive (SCN7A-IR) (b) nerve fibres on days 0–14 of experimental tooth movement (four mice per stage).
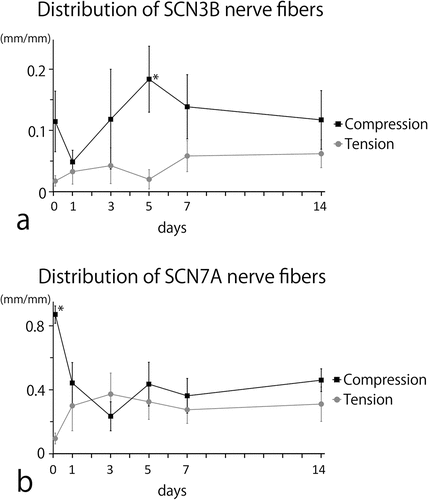
Figure 7. Microphotograph of sodium voltage-gated channel beta subunit 3 (SCN3B) (a), alpha subunit 7 (SCN7A) (b) and tartrate-resistant acid phosphatase (TRAP) staining in the compression area of the PDL after 5 days of tooth movement. SCN3B-immunoreactive nerve fibres (arrow in a) are very close to a TRAP-positive cell (arrowhead in a). However, SCN7A-IR nerve fibres (arrow) were distant from a TRAP-positive cell (arrowhead in a). Scale bar = 20 μm.
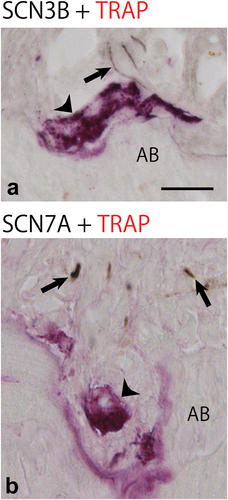
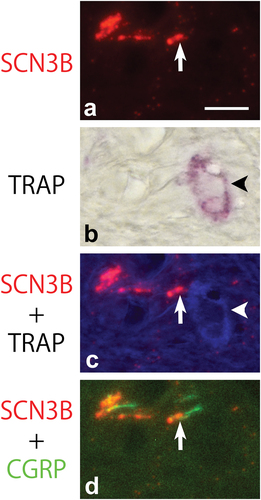
Figure 8. Microphotographs of sodium voltage-gated channel beta subunit 3 (SCN3B) (a, c, d), and tartrate-resistant acid phosphatase (TRAP) (b, c), and calcitonin gene-related peptide (CGRP) (d) in the compression area of the PDL after 5 days of tooth movement. All panels are in the same field of view. Arrows in a-d show nerve varicosities containing SCN3B and CGRP. The varicosities are near a TRAP-positive multinuclear cell (arrowheads in b and c). Scale bar = 10 μm (a). All panels are at the same magnification.