
Figures & data
Figure 1. The procedure of the experimental paradigm. (A) one trial of the paradigm, (B) one session of the paradigm.
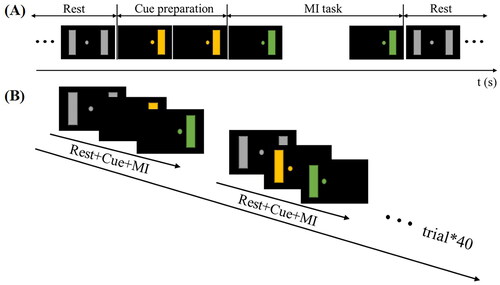
Figure 2. Topography of the alpha and beta bands during the left- and right-hand MI. (A) topography of the alpha band during the left MI task; (B) topography of the beta band during the left MI task; (C) topography of the alpha band during the right MI task; (D) topography of the beta band during the right MI task. The color bar on the right side represents the power value of all the topographies (the redder the color is, the greater the power value). The cue preparation was in [−1, 0 s], the MI ERD was in [0, 6 s], and the rest was in [6, 9 s].
![Figure 2. Topography of the alpha and beta bands during the left- and right-hand MI. (A) topography of the alpha band during the left MI task; (B) topography of the beta band during the left MI task; (C) topography of the alpha band during the right MI task; (D) topography of the beta band during the right MI task. The color bar on the right side represents the power value of all the topographies (the redder the color is, the greater the power value). The cue preparation was in [−1, 0 s], the MI ERD was in [0, 6 s], and the rest was in [6, 9 s].](/cms/asset/4a8c3d69-b095-4a08-8310-538ab0a00164/tbac_a_2147404_f0002_c.jpg)
Figure 3. The Δpower of the alpha and beta bands in [−1, 1 s]. (A) The time-varying Δpower of alpha and beta bands in the left and right MI task (the Δpower of the alpha band in the left MI task; the Δpower of the alpha band in the right MI task; the Δpower of the beta band in the left MI task; the Δpower of the beta band in the right MI task), in which the x-axis represented the time scale, and the y-axis represented the Δpower value (note: Δpower was the relative value between the ipsilateral and contralateral areas). (B) The statistical contrasts between alpha and beta bands in [−1, 0 s] and [0, 1 s]. Where the black columns are the alpha Δpower, and the grey columns are the beta Δpower. (* represents significance p < 0.05, and ** represents significance p < 0.01).
![Figure 3. The Δpower of the alpha and beta bands in [−1, 1 s]. (A) The time-varying Δpower of alpha and beta bands in the left and right MI task (the Δpower of the alpha band in the left MI task; the Δpower of the alpha band in the right MI task; the Δpower of the beta band in the left MI task; the Δpower of the beta band in the right MI task), in which the x-axis represented the time scale, and the y-axis represented the Δpower value (note: Δpower was the relative value between the ipsilateral and contralateral areas). (B) The statistical contrasts between alpha and beta bands in [−1, 0 s] and [0, 1 s]. Where the black columns are the alpha Δpower, and the grey columns are the beta Δpower. (* represents significance p < 0.05, and ** represents significance p < 0.01).](/cms/asset/623b7a49-5e4a-4956-a155-1f5c28df3ae1/tbac_a_2147404_f0003_b.jpg)
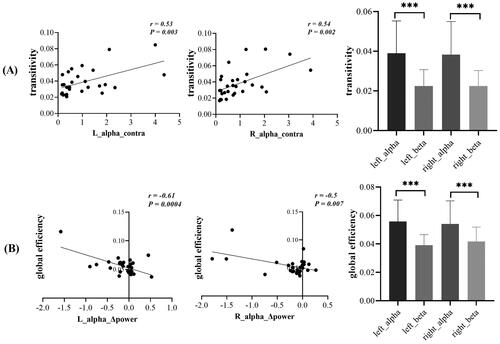
Figure 4. The correlation between brain network functions and the sensorimotor rhythms of the alpha and beta bands (r is the correlation coefficient, and p is the statistical value). (A) The correlation between the transitivity in resting intervals and the contralateral power spectra during the MI tasks in the alpha and beta bands. (B) The correlation between the global efficiency in resting intervals and the Δpower during the MI tasks in the alpha and beta bands. The transitivity was higher in the alpha band (left: alpha–beta, p < 0.001; right: alpha–beta, p < 0.001). Similarly, the global efficiency was also higher in the alpha band (left: alpha–beta, p < 0.001; right: alpha–beta, p = 0.001). *** represents significance.
Supplemental Material
Download MS Word (1.1 MB)Data availability statement
The raw data supporting the conclusions of this article will be made available by the authors without undue reservation.