
Figures & data
Figure 1. Sleep behaviors and facial expressions and EEG combine measure scheme.
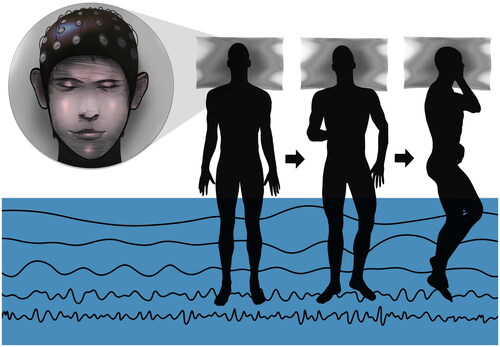
Figure 2. The figure shows the alpha topographic map of the average power of each wave every 30 min. The darker the color, the stronger the power in the region, with a positive increase in red and negative increase in blue.
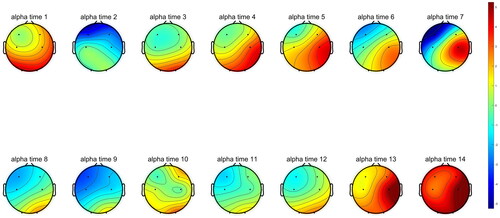
Figure 3. The figure show the delta topographic map of the average power of each wave every 30 min. The darker the color, the stronger the power in the region, with a positive increase in red and negative increase in blue.
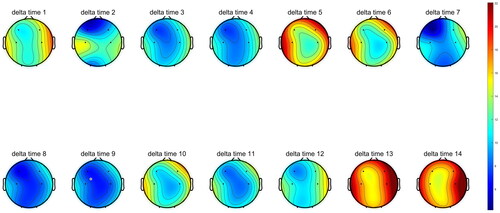
Figure 4. The figure show the beta topographic map of the average power of each wave every 30 min. The darker the color, the stronger the power in the region, with a positive increase in red and negative increase in blue.
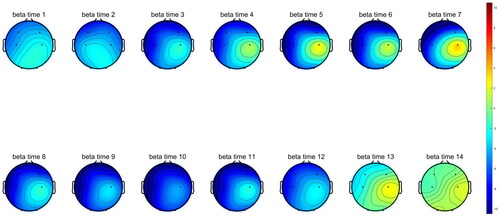
Figure 5. The figure shows the gamma topographic map of the average power of each wave every 30 min. The darker the color, the stronger the power in the region, with a positive increase in red and a negative increase in blue.
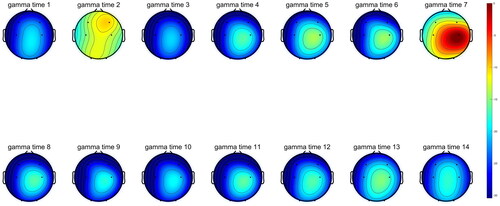
Figure 6. The figure show the theta topographic map of the average power of each wave every 30 min. The darker the color, the stronger the power in the region, with a positive increase in red and negative increase in blue.
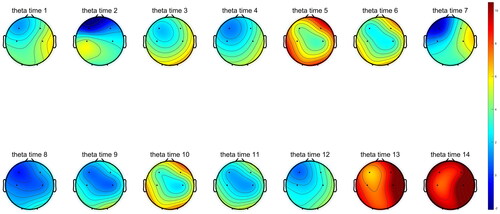
Figure 7. Trends of sleep behaviours within 7 h of sleep.
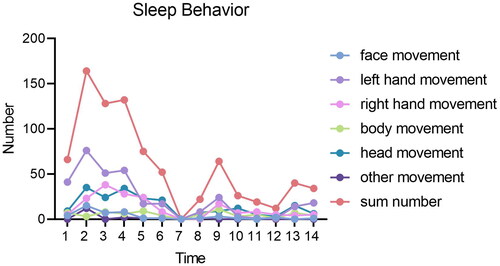
Figure 8. Trends of facial expressions within 7 h of sleep.
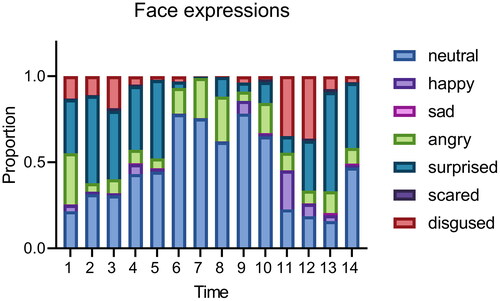
Table 1. Correlation analysis of alpha wave means power changes with facial expressions and sleep behavior.
Table 2. Correlation analysis of beta wave mean power changes with facial expressions and sleep behavior.
Table 3. Correlation analysis of delta wave mean power changes with facial expressions and sleep behavior.
Table 4. Correlation analysis of gamma wave mean power changes with facial expressions and sleep behavior.
Table 5. Correlation analysis of theta wave mean power changes with facial expressions and sleep behavior.