
Figures & data
Table 1. Details of the four datasets.
Figure 1. The Conv_dilation extract hemodynamic response information from fNIRS.
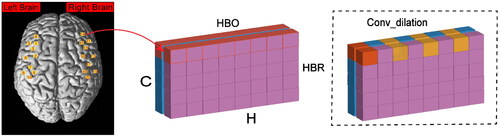
Figure 2. The ID-CapsuleNet includes two Conv_dilations for feature extraction. After dynamic routing, the size of the output vectors is computed.
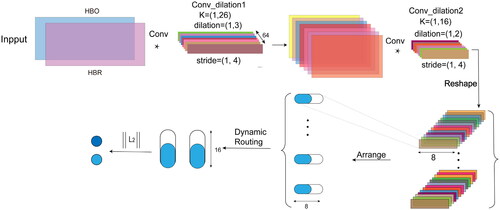
Table 2. Parameter settings of the model.
Table 3. Average accuracy of the test sets.
Figure 3. Classification accuracy for individual subjects.
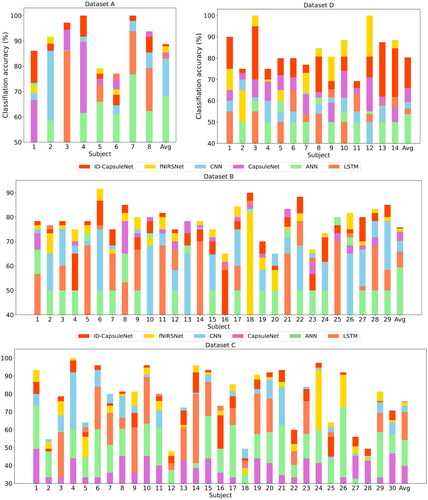
Table 4. Average classification results of all individual subjects.
Table 5. Average classification results of different convolution.
Table 6. The parameters of different convolution.
Table 7. Average classification results of different loss.
Table 8. Average accuracy of the test sets.