Figures & data
Figure 1. The schematic diagram of EEG acquisition channels.
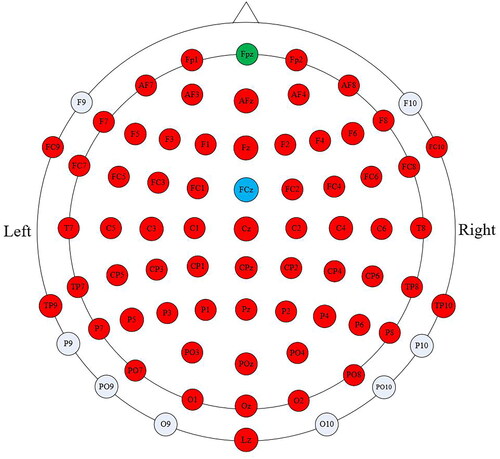
Figure 2. The Schematic of the experimental setup.
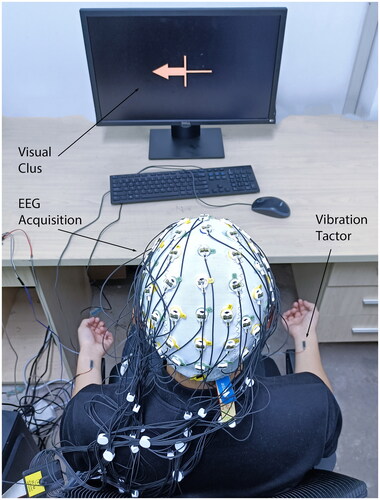
Figure 3. Experimental procedure of the two sessions. Each session contains two runs, and each run consists of 40 trials.
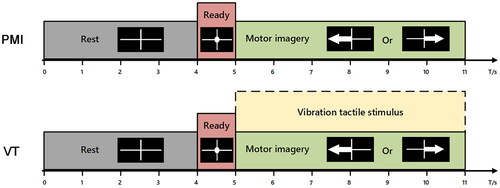
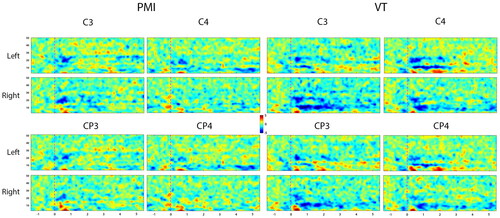
Figure 4. Grand-averaged spatial distributions of ERSP patterns of all subjects for each class and frequency band. Each row displays the ERSP changes during the first 5 s after imagery begins.
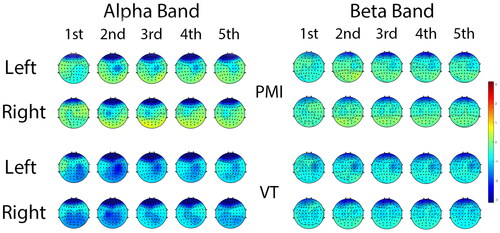
Figure 5. The peak ERD values over the C3 and C4 channels for two sessions for all subjects. Where * represents p < 0.05.
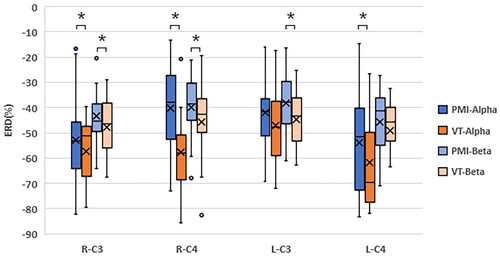
Figure 6. The average PLV values of all channels under different frequency bands over time.
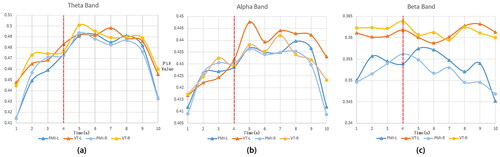
Figure 7. The average decoding rate changes for all subjects. Where *represents p < 0.05.
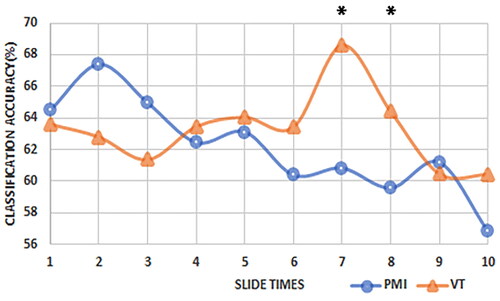
Table 1. Classification accuracies and mean accuracies in two conditions over 14 subjects.
Figure 8. The cortical activations in time-frequency domains for subject S12.