Figures & data
Table 1. Missing data by service indicators
Table 2. Stationarity test
Figure 1. Trend graphs for services indicators.
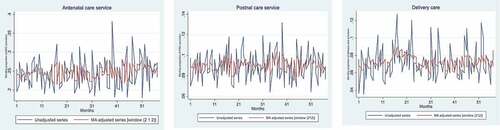
Table 3. Selection of model functional form
Table 4. GLS-based estimates (imputed data)
Table 5. GLS-based estimates (unimputed data)
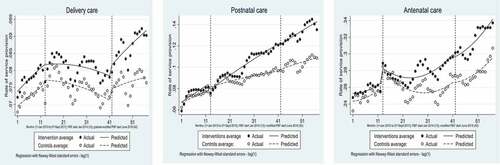
Figure 2. Interrupted time series graphs (imputed data).
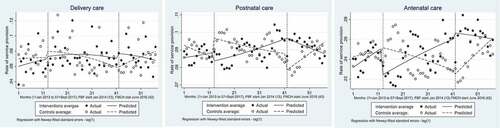
Figure 3. Interrupted time series graphs (unimputed data).