
Figures & data
Figure 1. Density of households receiving filters and participating in surveys, by geographic region
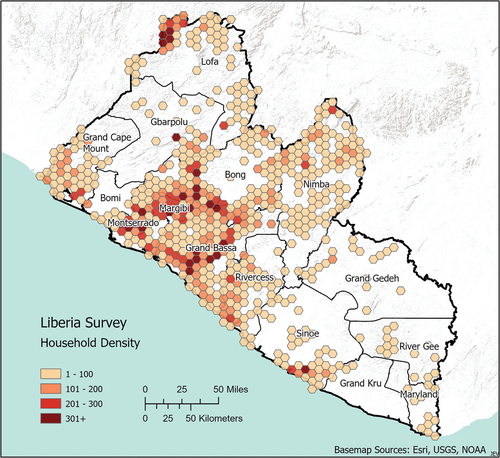
Figure 2. Flow chart depicting inclusion and exclusion criteria for the analyses in this study
Table 1. Participant characteristics. For total rows, percentages are out of the total sample size. When stratifying by age, water source, county, and household size, percentages are out of the total number of people or households participating at a given time point (baseline, 2 weeks, or 8 weeks)
Table 2. Changes in diarrhoeal rates from baseline to 8 weeks by age. N is the total number of people, and N_RS is the number of people with running stomach (diarrhoea). The overall change (%) gives percentage change of running stomach prevalence from baseline to eight weeks, computed by subtracting the baseline percentage from the 8-week percentage and then dividing by the baseline percentage (and finally multiplying by 100 to obtain the percent change)
Figure 3. Reported diarrhoeal prevalence at the initial visit and at follow-up visits approximately two and eight weeks later
Table 3. Odds of diarrhoea by participant characteristics. This table presents results from the mixed-effects logistic regression model. Base levels for each variable are water source: Creek, County: Bong, timepoint: baseline, season: dry, and age group: adults
Data availability statement
The data are not available due to the protection of participant privacy.