
Figures & data
Figure 1. A map of Kejetia the study area.
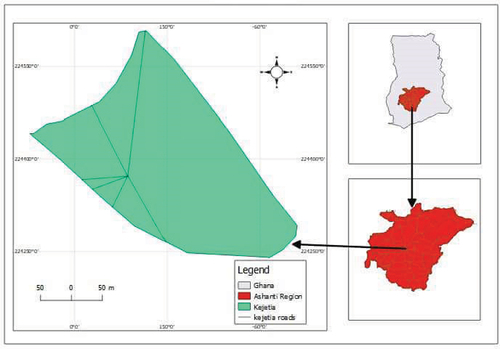
Table 1. Results of recovery studies and LOD and LOQ
Table 2. Mean concentrations (mg/kg) of heavy metals in cosmetics
Table 3. Margin of Safety for heavy metals using 100% bioaccessibility
Table 4. Hazard Quotient (HQ) of heavy metals in cosmetics using 100% bioaccessibility
Table 5. Carcinogenic risk of chromium for dermal exposure pathway for body cream and lotion samples (100% bioaccessibility)
Table 6. Carcinogenic risk of Arsenic for dermal exposure pathway for body cream and lotion samples (100% bioaccessibility)
Figure 2. Heavy metal concentrations in cosmetic samples (A) Pb concentrations (mg/kg) in cosmetic samples (B) as concentrations (mg/kg) in cosmetic samples (C) Cd concentrations (mg/kg) in cosmetic samples (D) Fe concentrations (mg/kg) in cosmetic samples (E) Ni concentrations (mg/kg) in cosmetic samples (F) Cr concentrations (mg/kg) in cosmetic samples (G) Hg concentrations (mg/kg) in cosmetic samples.
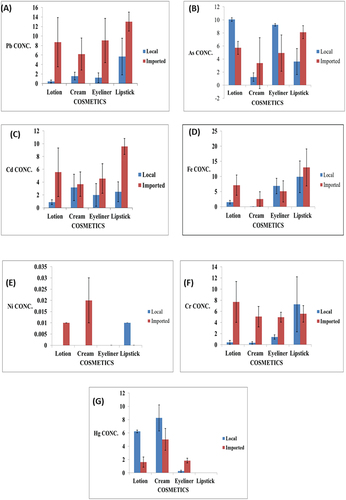
Figure 3. HI values versus cosmetic samples.
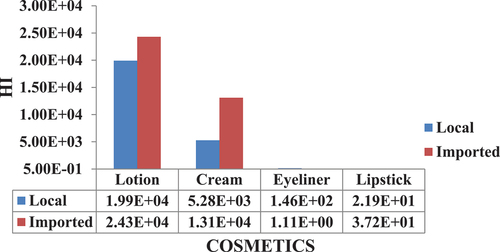
Figure 4. Comparing Pb concentration with EU, WHO, and USFDA limits.
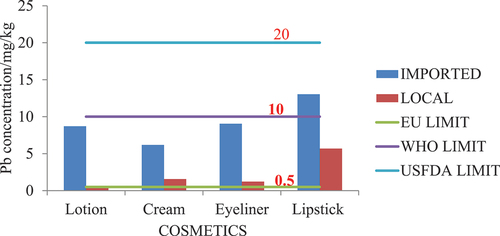
Figure 5. Comparing the Cd concentration with EU and WHO limits.
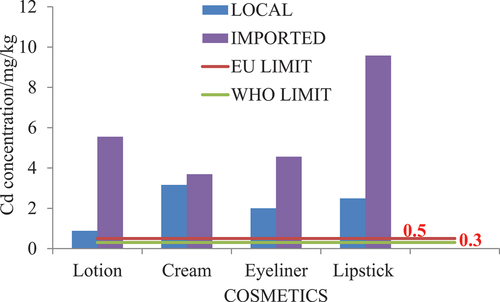
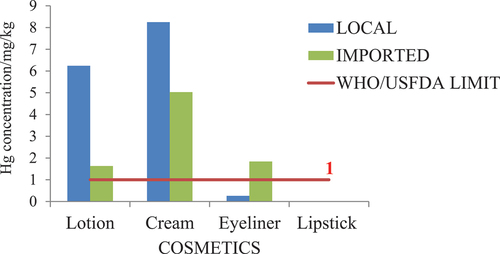
Figure 6. Comparing Hg concentration with WHO and USFDA limit..
Data availability statement
The data is found in the manuscript or immediately available from the authors