
Figures & data
Table 1. Demographic and clinical characteristics of prostate cancer patients
Table 2. Bivariate analysis of background and clinical characteristics of prostate cancer patients from Zambia Cancer Disease Hospital routinely collected data, 2014–2018
Figure 1. Kaplan–Meier (K-M) estimate of HIV-negative patients’ prostate cancer had lower mortality than the patients exposed to HIV, with 95% confidence interval.
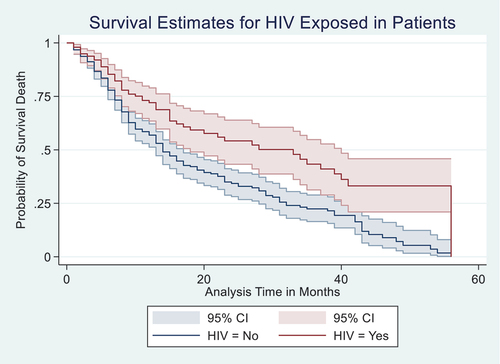
Figure 2. Kaplan–Meier (K-M) estimate of patients with Gleason scores of less than or equal to 8 had lower mortality compared to those who had Gleason scores of greater than 8, with 95% confidence interval.
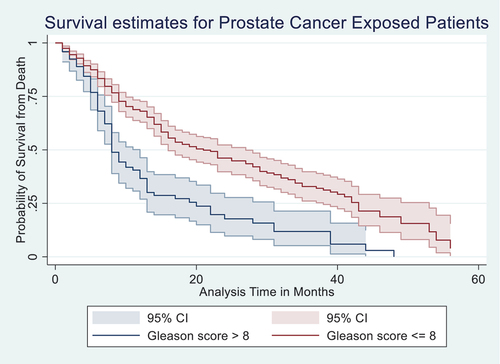
Figure 3. Kaplan–Meier (K-M) estimate of patients on hormonal therapy treatment had lower mortality compared to those who were not on the treatment, with 95% confidence interval.
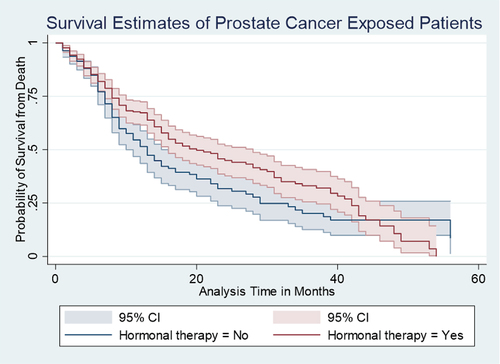
Table 3. Crude and adjusted Weibull model of factors associated with mortality of prostate cancer patients
Data availability statement
The data for this article supporting the findings will be made available once requested by the reviewer for supporting the conclusions.