
Figures & data
Figure 1. State-wise percentage of indigenous women and child population.
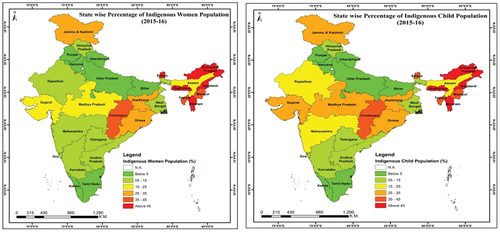
Table 1. State-wise indigenous population in India, 2016
Figure 2. Prevalence of maternal and child health among the indigenous and non-indigenous population with their age group- (a) asthma; (b) heart diseases; (c) cancer; (d) diabetes; (e) stunting; (f) underweight; (g) IMR.
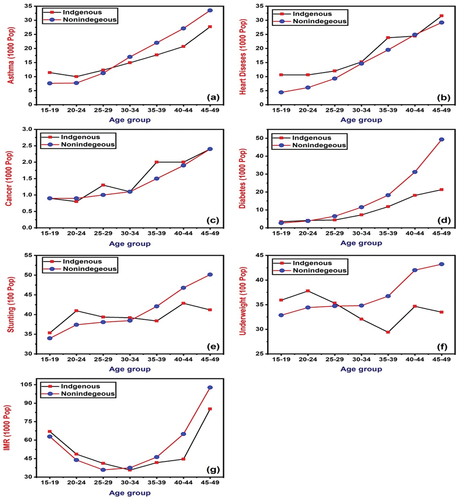
Table 2. Differences in prevalence of non-communicable diseases per 1000 women among the indigenous and non-indigenous group population in India, 2015–16
Table 3. Percentages of stunting, wasting, underweight, and infant mortality rate per thousand children among the indigenous group population India, 2015–16
Table 4. Odd’s ratio of non-communicable diseases among the indigenous women in India, 2015–16
Table 5. Odds ratios of child stunting, wasting, underweight and infant mortality among the indigenous population in India, 2015–16
Figure 3. Prevalence of maternal vulnerability among the indigenous population.
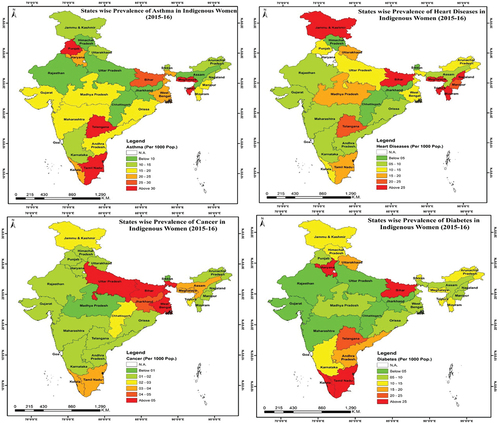
Figure 4. Prevalence of stunting, wasting, underweight, and IMR in indigenous child.
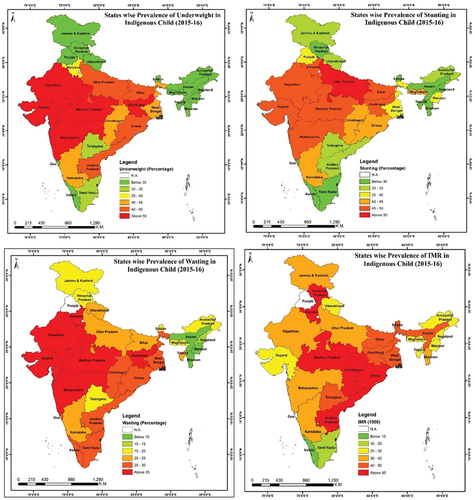
Table A1. States wise prevalence of non-communicable diseases in women and child health among the indigenous population in India, 2015–16