Figures & data
Table 1. Comparison of the 3 Intervention Groups in terms of Microbial Load Reduction
Table 1. Difference in weight gain velocity (g/day) from enrollment to age 4 months
Figure 1. Bifidobacterium (total and infant-type) abundance at baseline and at age 3 months (abundance shown on a pseudo-log scale). In the FAS, EF group had significantly increased Bifidobacterium abundance compared to CF group at age 3 months (* p<0.05; total Bifidobacterium abundance (median (interquartile range [IQR])): EF: 44.7% (30.8%); CF: 34.1% (29.3%), infant-type Bifidobacterium abundance: EF 31.4% (24.5%); CF: 22.6% (27.0%)). Boxplots display the lower and upper quartiles (upper and lower box edges, respectively), the median (horizontal line inside box), and the extreme of the data observations within 1.5*IQR(whiskers).
![Figure 1. Bifidobacterium (total and infant-type) abundance at baseline and at age 3 months (abundance shown on a pseudo-log scale). In the FAS, EF group had significantly increased Bifidobacterium abundance compared to CF group at age 3 months (* p<0.05; total Bifidobacterium abundance (median (interquartile range [IQR])): EF: 44.7% (30.8%); CF: 34.1% (29.3%), infant-type Bifidobacterium abundance: EF 31.4% (24.5%); CF: 22.6% (27.0%)). Boxplots display the lower and upper quartiles (upper and lower box edges, respectively), the median (horizontal line inside box), and the extreme of the data observations within 1.5*IQR(whiskers).](/cms/asset/2b060be9-0240-4dc8-bce0-6c3765600bb4/oamd_a_2275942_f0004_oc.jpg)
Figure 1. Proportion of students without and with self-reported chronic health conditions and disabilities (CC/D) reporting having difficulties, by domain of functioning.
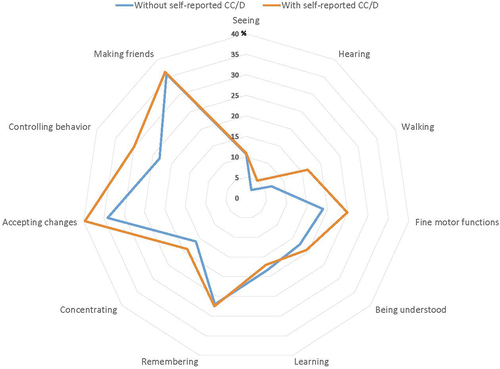
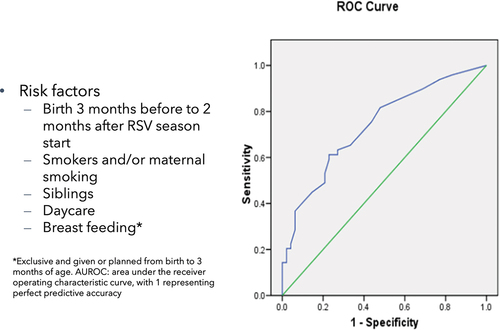
Figure 1. Associations between RSV infection and the presence of wheezing in children aged below 6 years old in the overall survey sample (n=600in the RSV group, n=600 in the Reference group) and in subgroups of hospitalised RSV infection (n=269) or paediatric intensive care unit (PICU) admission for RSV (n=112).
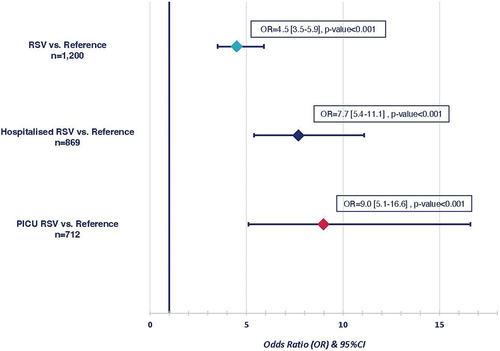
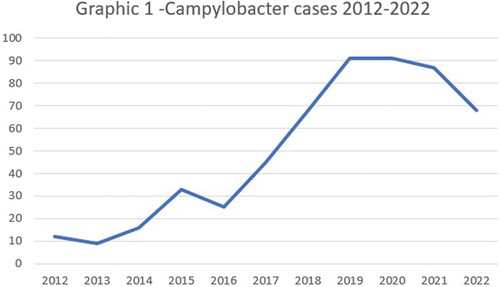
Figure 1. Campulobacter cases 2012-2022.
Table
Table
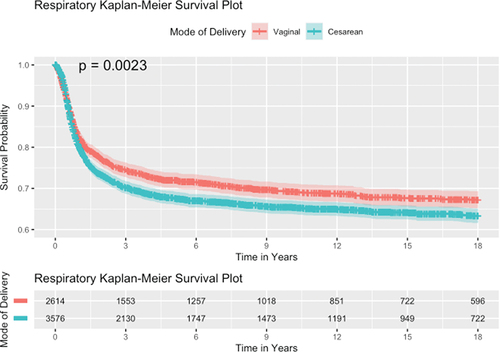
Figure 1. Unadjusted annualized total SCS coursesa during VOYAGE in patients with type 2 inflammatory phenotype (baseline blood eosinophils ≥150 cells/µL or FeNO ≥20 ppb), stratified per number of prior exacerbations.Type 2 patients with 1 prior exacerbation Type 2 patients with 2 prior exacerbations Type 2 patients with ≥3 prior exacerbations
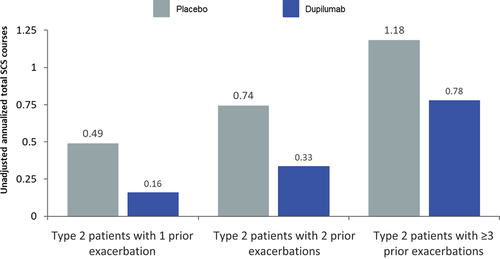
Figure 1. a) Enlargement of mediastinum in the chest radiography; b) MRI showing pericardial cyst in the right hemithorax, measuring 61.6 x 41.3mm.
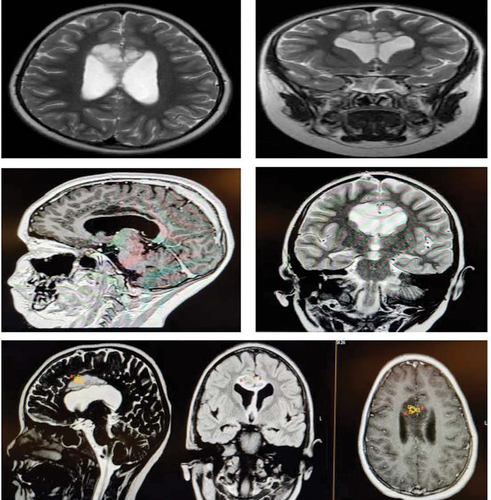
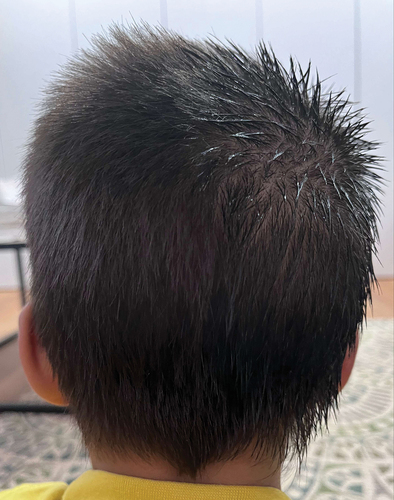
Figure 1. Bilateral bulbarconjunctival telangiectasia.
Table 1. Mean and standard deviation of the overall level of self-regulation and its three dimensions for the subgroups divided by sex variable
Table 2. The values of the Pearson r correlation coefficients between the dimensions of the Self-Regulation Scale and its overall score and selected variables in the total sample
Table 3. Linear regression of variables for the study of dependence on social networks in relation to the well-being of adolescents
Table 1. Phychological Symptoms im adolescentes across Mediterranean countries
Table 2. Adolescents Life Satisfaction across Mediterranean countries
Table 3. Communication with parents across Mediterranean countries
Figure 2. Illustrates the proportion of patients prescribed IV aciclovir for suspected meningitis/encephalitis, suspected eczema herpeticum, and other indications.
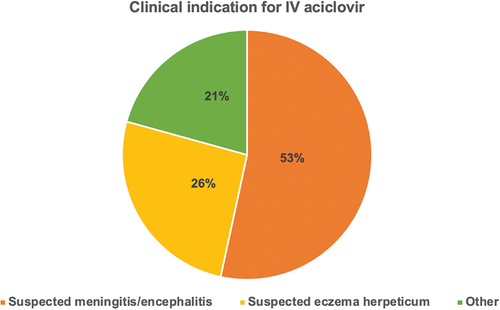
Table 1. Laboratory test Results: biochemistry
Table
Table 1. Support and Bullying Experiences by Country and Physical Disability Status
Table 1. Vascular endothelial growth factor indicator in children with juvenile arthritis with systemic onset
Table 1. Number of patients with anemia and malnutrition depending on the type of feeding (%)
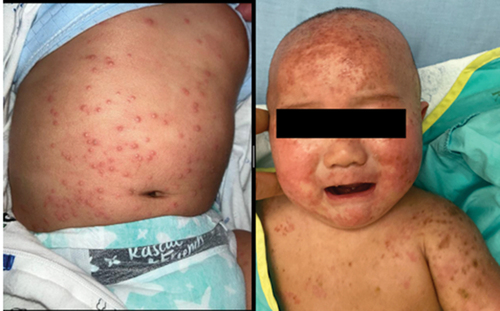
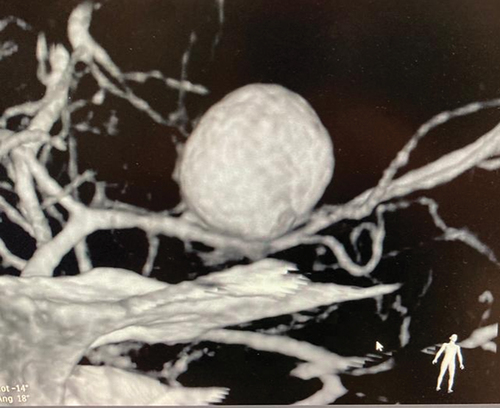
Figure 1. Bilateral bulbar conjunctival telangiectasia.
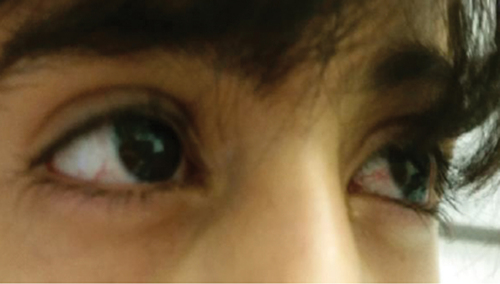
Figure 2. MRI showing cerebellar atrophy.
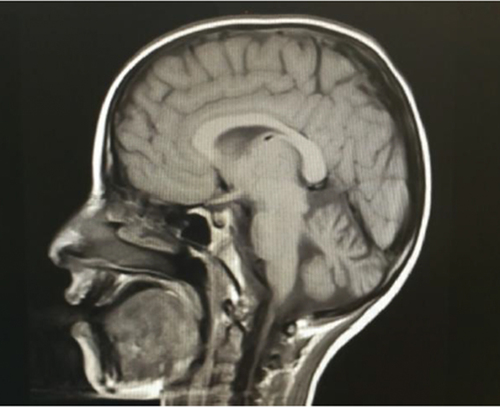
Table 1. Evaluation of children’s neophobia status and food preferences
Table 1. Evaluation of nutrient intake and KIDMED scores
Table 1. Regression models predicting the negative impact of COVID-19 on different domains of adolescents’ lives
Table 1. The relationship of sociodemographic, social supports, well-being and media use factors with PSMU in univariate analysis
Table 1. Adaptation of children/adolescents with autism and their mothers to the Mediterranean diet
Figure 1. Data sources and results of meta-analysis of MARI rates for pallvizumab versus placebo (A) and pallvizumab versus nirsevimab (B).
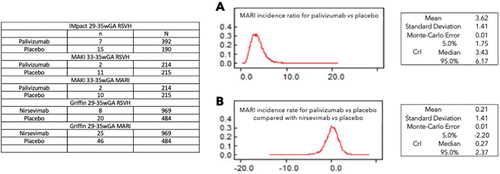
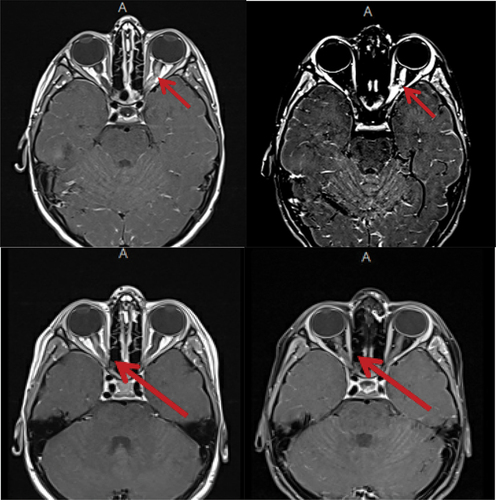
Figure 1. MRI Brain showing recurrent optic nerve enhancements; initially left sided and subsequently right sided.
Table
Table 1. The impact of Covid-19 pandemic on adolescent loneliness (%)
Table 1. Level of Anxiety of senior High school Students in a Public High School in Las Piñas City
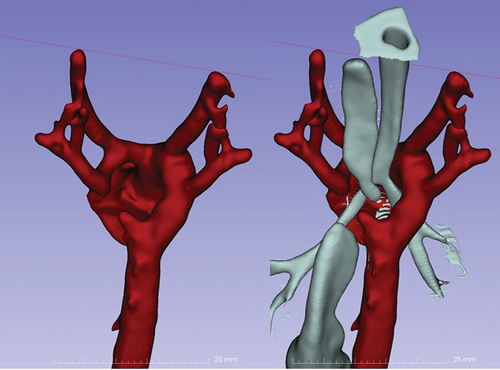
Figure 1. Doble aprtic Arch: CTA with three-dimensional reconstruction of the vascular ring that encircles the trachea and esophagus.