
Figures & data
Figure 1. Food insecurity phase in December 2020 and March 2021.
Source: Computed from the survey, 2021 and USAID, 2020.
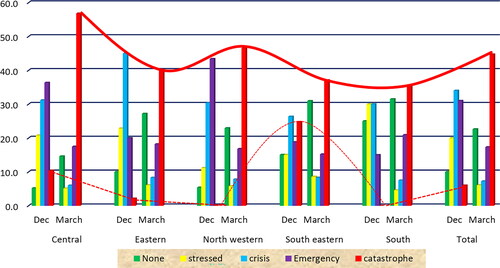
Table A1. Sample size by zone, woreda, and sex.
Table A2. Household features.
Table A3. Level and gap of food insecurity by woreda.
Table A4. Food insecurity phases across woreda.
Table A5. Food security first level outcomes description and indicators of the IPC phases.
Table 1. Intensity, depth, and severity of food insecurity of households by zone and settlement type.
Table 2. Estimates of acute food insecurity at regional and zone levels (IPC phase), 2021.
Table 3. Rural–urban estimates of acute food insecurity (IPC phase), 2021.
Table 4. Determinants of food security.