Figures & data
Table 1. Bath composition and deposition conditions.
Figure 1. (a) Represents the SEM image of bare mild steel. (b–f) Demonstrates the surface topography of electrodeposited samples by SEM at concentrations of 0, 0.25, 0.50, 0.75, and 1 gl−1 of niobium oxide, respectively.
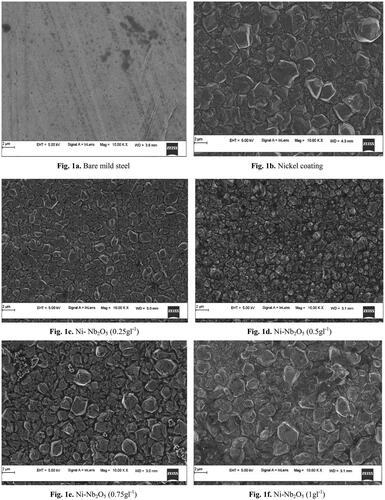
Figure 2. XRD plots of Ni and Ni-Nb2O5 coating.
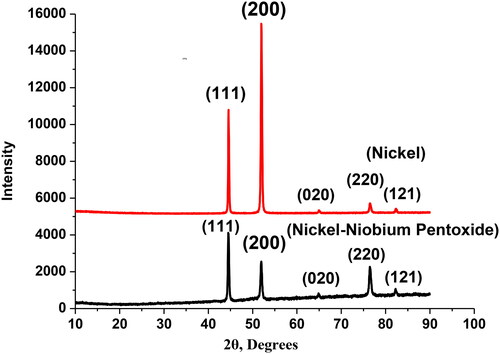
Figure 3. EDAX analysis of Ni- Nb2O5 Coating.
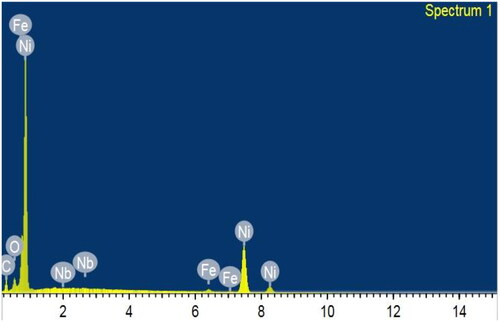
Table 2. Elemental composition of Nickel- Nb2O5 coated specimen.
Figure 4. Texture coefficient plots of nickel and Ni- Nb2O5 coatings.
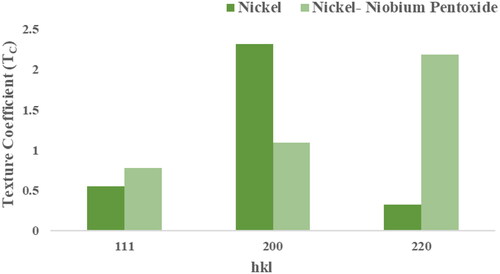
Figure 5. Polarisation curves of Ni and Ni-Nb2O5 composite coated samples.
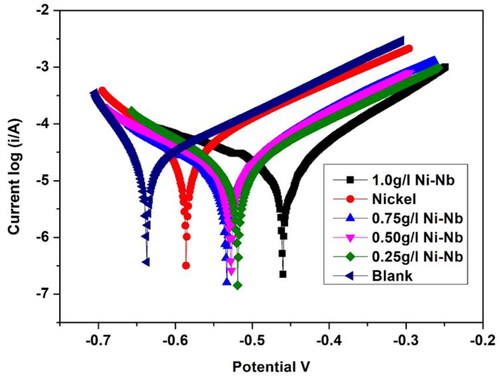
Table 3. Tafel extrapolation data.
Figure 6. Nyquist graphs for Ni and Ni-Nb2O5 composite coating.
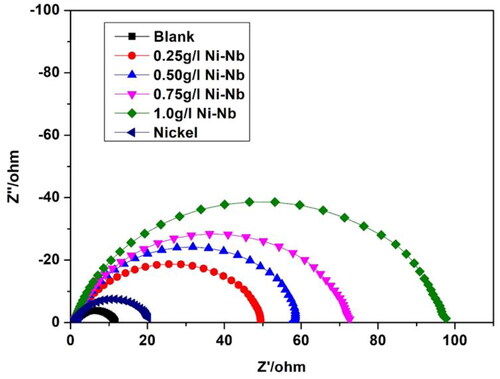
Figure 7. Equivalent circuit for the Nyquist plots. R: Resistance; CR: Current Rectifier; QR: Quick Response.
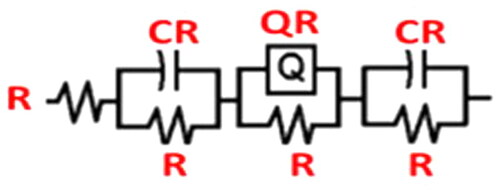
Table 4. Impedance spectroscopy data.
Figure 8. Microhardness of Ni and Ni- Nb2O5 coating.
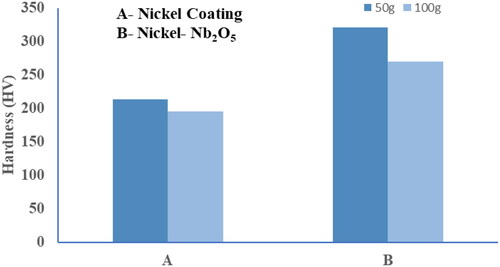
Figure 9. AFM image of Nickel coating.
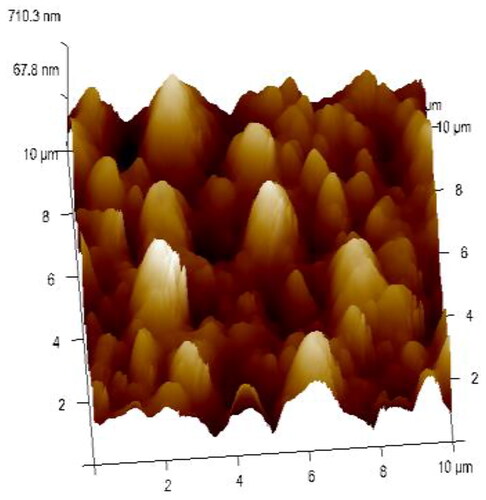
Figure 10. AFM image of Ni- Nb2O5 Coating.
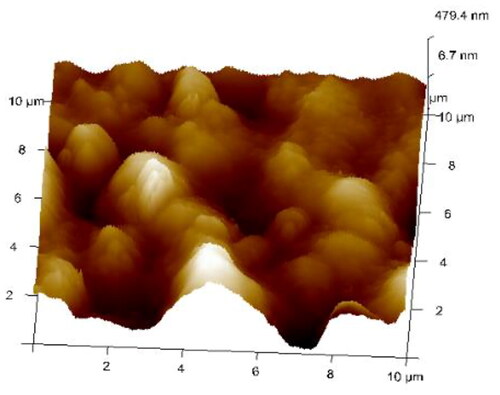
Table 5. Roughness data.
Figure 11. 3D profile of Ni- Nb2O5.
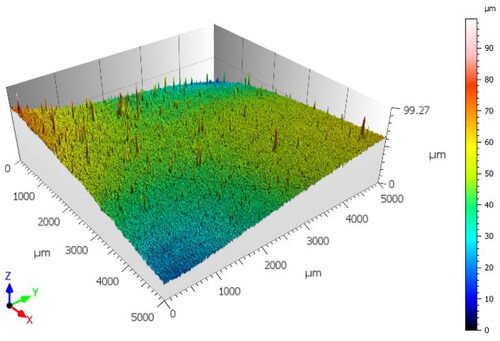
Figure 12. 2D profile of Ni- Nb2O5.
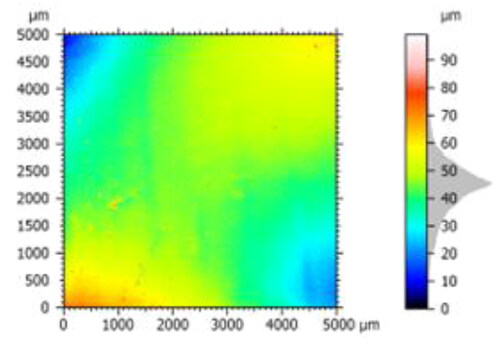
Figure 13. Normal load vs stroke.
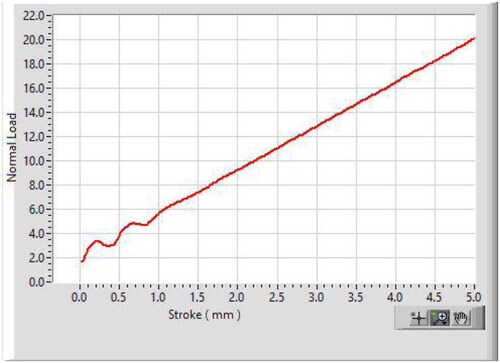
Figure 14. SEM Image of the scratch path.
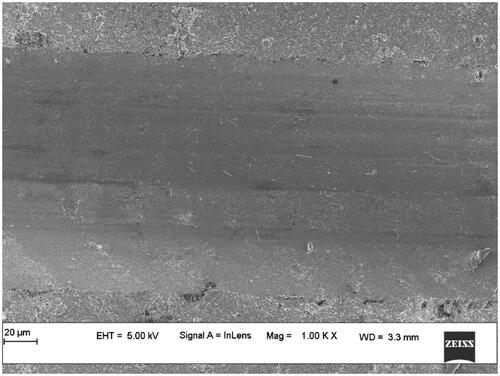
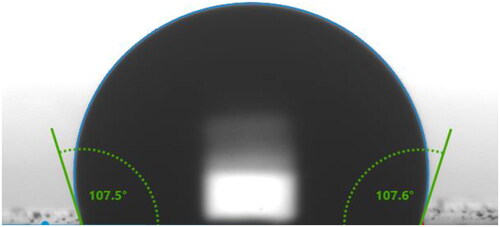
Figure 15. Contact angle of nickel coating.
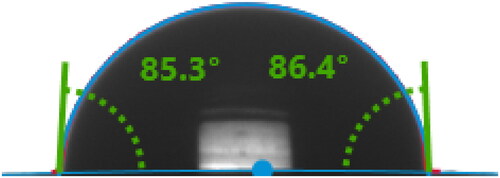
Figure 16. The contact angle of Nickel- Nb2O5 (1 g/l) coating.