Figures & data
Table 1. Discussed disciplines summarized per definitions given in the text.
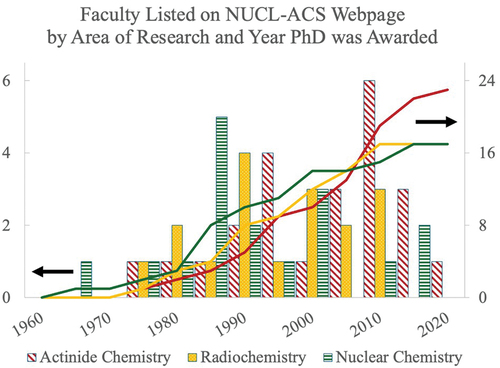
Figure 1. A comparison of the years that faculty listed on the NUCL-ACS webpage were awarded their PhDs, by sub-field of chemistry as defined in this work. Data were collected by surveying the faculty webpages and/or by the publication date of their dissertation. Data are binned on a half-decadal basis. The bar graphs are on the scale to the left y-axis, while the cumulative timeline is scaled to the right.