Figures & data
Figure 1. Plastic waste management from 1960 to 2018 in the US[Citation1].
![Figure 1. Plastic waste management from 1960 to 2018 in the US[Citation1].](/cms/asset/14abf240-c2db-4477-8469-4bd78ab5ce56/tess_a_2362676_f0001_oc.jpg)
Figure 2. PET alcoholysis process.
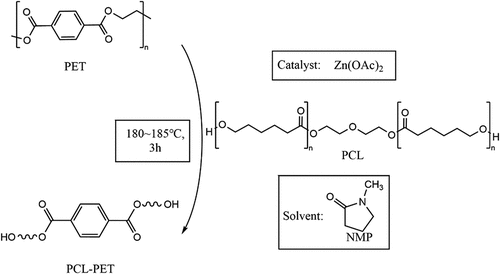
Table 1. The naming of electrically conductive elastomers (based on the mass of LiTFSI).
Figure 3. Prepolymerization and polymerization process of preparation of electrically conductive elastomers.
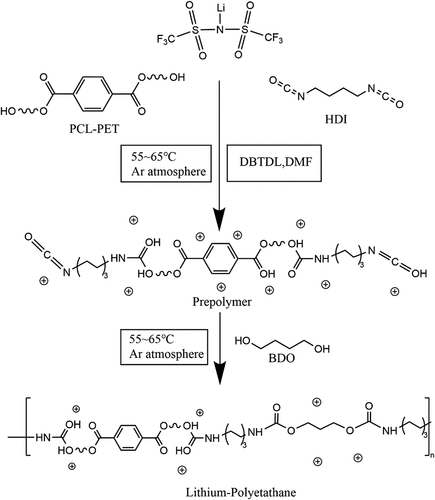
Figure 4. (a) The electrically conductive elastomer product before drying; (b) The electrically conductive elastomer product after drying 18 hours.
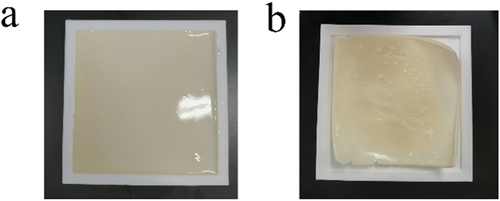
Figure 5. The structure of electrically conductive elastomers.
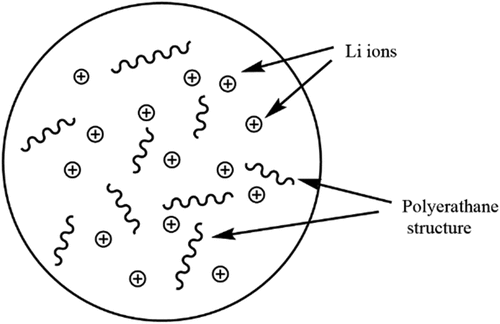
Figure 6. The survey scans the XPS spectrum of 20% LiTSFI conductive elastomer.
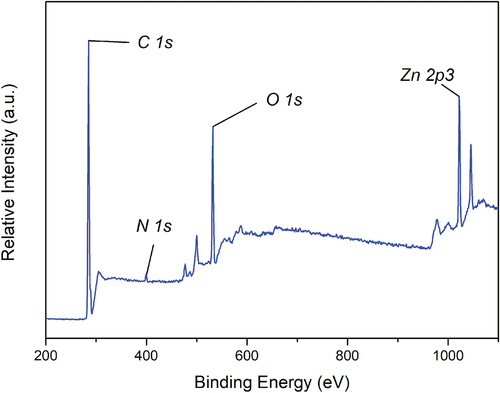
Figure 7. (a) The C1s region scan XPS of 20% LiTSFI conductive elastomer; (b) the N1s region scan XPS of 20% LiTSFI conductive elastomer; (c) the O1s region scan XPS of 20% LiTSFI conductive elastomer; (d) the F1s region scan XPS of 20% LiTSFI conductive elastomer; (e) the S2p region scan XPS of 20% LiTSFI conductive elastomer; (f) the Li1s region scan XPS of 20% LiTSFI conductive elastomer.
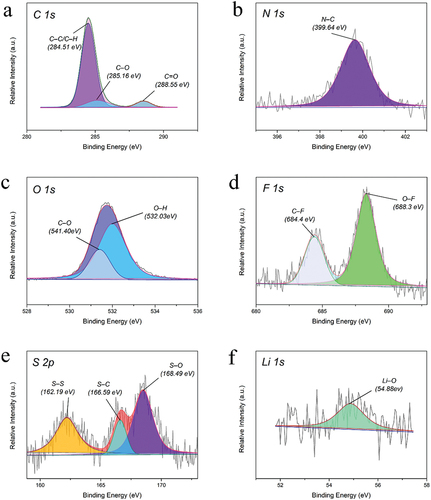
Figure 8. FT-IR spectroscopy of electrically conductive elastomers.
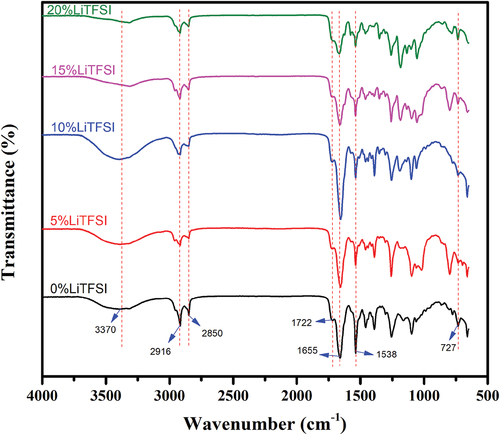
Table 2. Carbon, hydrogen, and nitrogen content of conductive elastomers of different masses of LiTSFI.
Figure 9. The surface and cross-section SEM images of conductive elastomers.
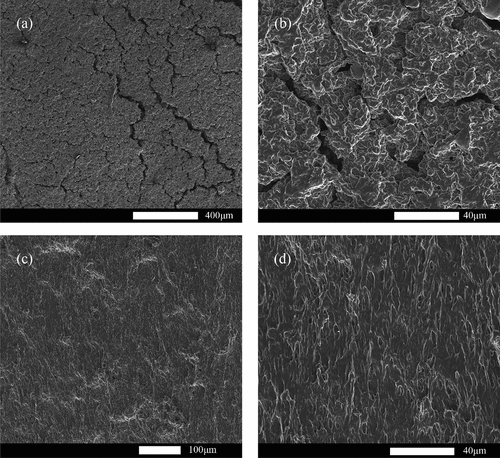
Figure 10. Conductivity rate of electrically conductive elastomers.
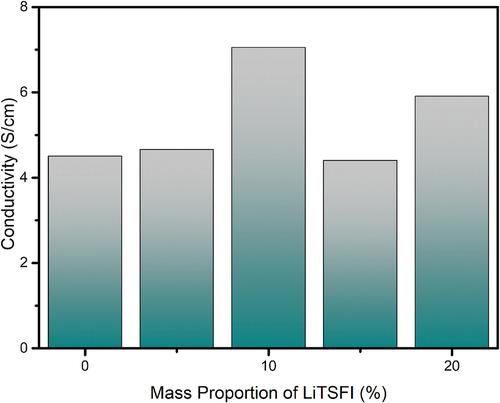
Figure 11. Thermal diffusivity of electrically conductive elastomers.
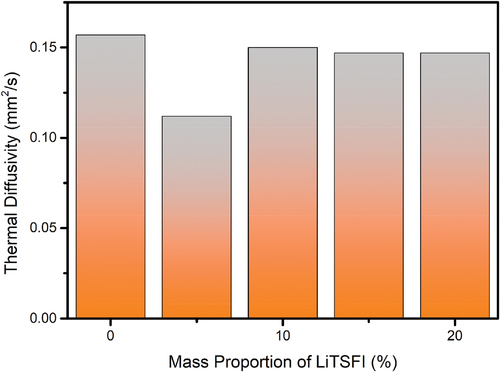
Figure 12. Thermogravimetric analysis diagram of conductive elastomers.
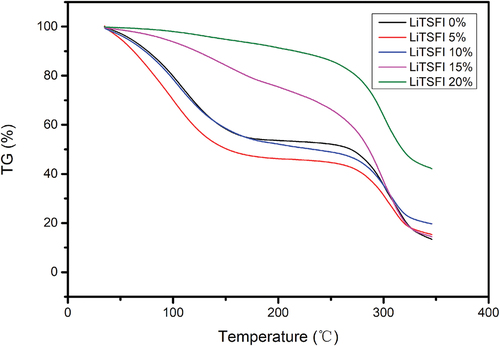
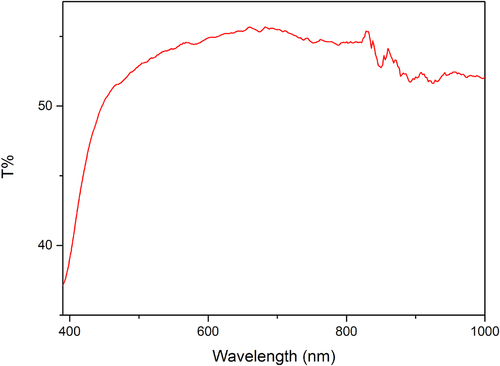
Figure 13. Light transmittance of conductive elastomers.