
Figures & data
Figure 1. Chemical structure of efonidipine hydrochloride.
Figure 2. Chemical structure of telmisartan.
Figure 3. UV spectra of both drugs for selection of analytical wavelength.
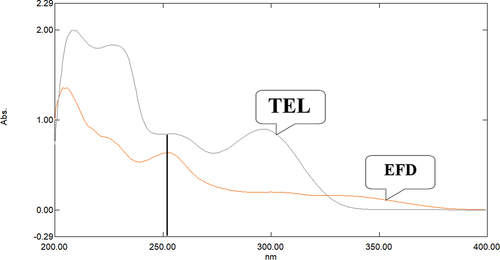
Figure 4. Chromatogram of EFD and TEL in optimized mobile phase.
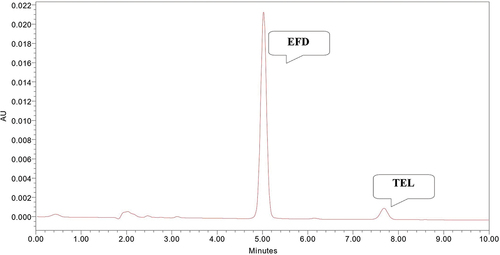
Table 1. Regression analysis of calibration curve of EFD and TEL.
Table 2. Intermediate precision of EFD and TEL.
Table 3. Summary of validation parameter of EFD and TEL.
Table 4. Robustness studies of EFD and TEL.
Figure 5. Chromatogram showing peak of TEL (10 µg/ml) and EFD (10 µg/ml) at 70° C for 4 hours in 0.1 N HCl.
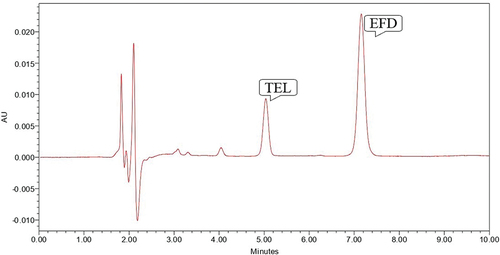
Figure 6. Chromatogram showing peak of TEL (10 µg/ml) and EFD (10 µg/ml) at 70° C for 2 hours in 0.1 N NaOH.
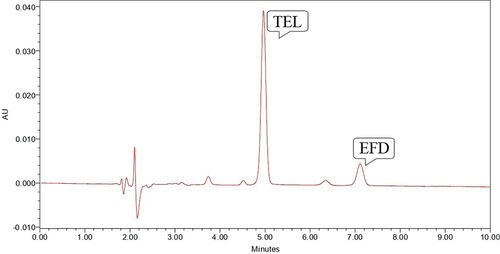
Figure 7. Chromatogram showing peak of TEL (10 µg/ml) and EFD (10 µg/ml) at 70° C for 4 hours in 0.1 N NaOH.
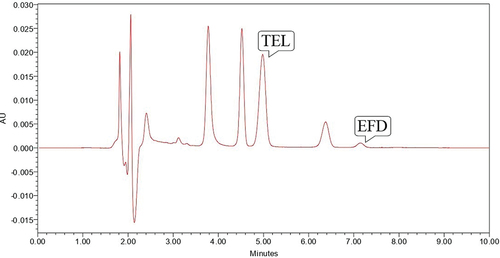
Figure 8. Chromatogram showing peak of TEL (10 µg/ml) and EFD (10 µg/ml) at 70° C for 60 minutes in 3% H2O2.
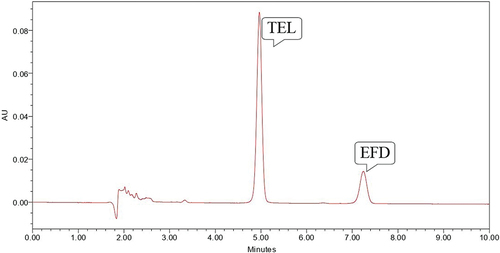
Figure 9. Chromatogram showing peak of TEL (10 µg/ml) and EFD (10 µg/ml) at 70–80° C for 120 minutes.
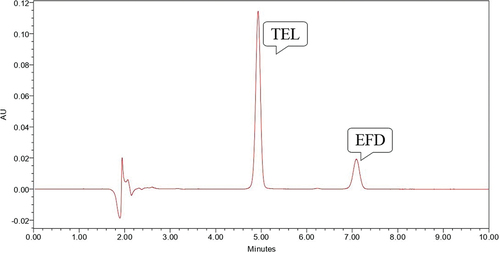
Figure 10. Chromatogram showing peak of TEL (10 µg/ml) and EFD (10 µg/ml) under UV Light for 24 hours.
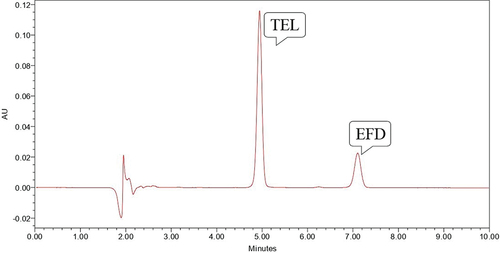
Table 5. Result of stability study of proposed method.
Table 6. Result of system suitability parameters for developed method of EFD and TEL.