
Figures & data
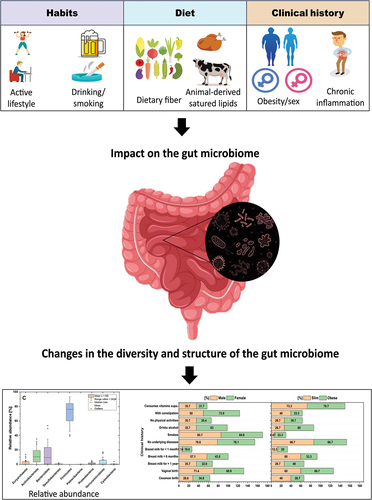
Figure 1. Data distribution of participants’ responses on the provided questionary. Data was separated based on participants’ sex, BMI (normal weight [NW] and overweight [OW]), and the combination of both sex and BMI. The percentage of positive responders among each group is shown. The categories include diet, habits, and clinical history.
![Figure 1. Data distribution of participants’ responses on the provided questionary. Data was separated based on participants’ sex, BMI (normal weight [NW] and overweight [OW]), and the combination of both sex and BMI. The percentage of positive responders among each group is shown. The categories include diet, habits, and clinical history.](/cms/asset/569aeaa7-0afd-49a1-8384-8f7a3790e4b1/kgmr_a_2332988_f0001_oc.jpg)
Figure 2. Fecal microbiome composition of Paraguayans from the Metropolitan area of Asunción based on 16S rRNA sequencing. (A) Alpha-diversity (Shannon index) distribution across samples, calculated at a depth of 5000 reads. (B) Shannon index values based on sex and BMI values distributed as normal and overweight. (C) Microbial relative abundance at the Phylum level across samples. (D) the twenty most abundant genera across samples. Colors tabulated based on their phyla.
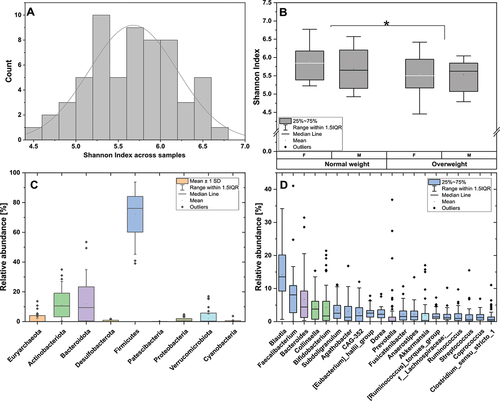
Figure 3. Significant associations identified at the phylum (A) and genus (B) levels, via multivariate associations with linear models as implemented by MaAsLin2 R-packageCitation19 (FDR < 0.25), between the gut microbiota structure and the diet, habits, and clinical history of the Paraguayan cohort. Each association analysis was adjusted for fixed effects according to the data distribution and as previously suggested.Citation20
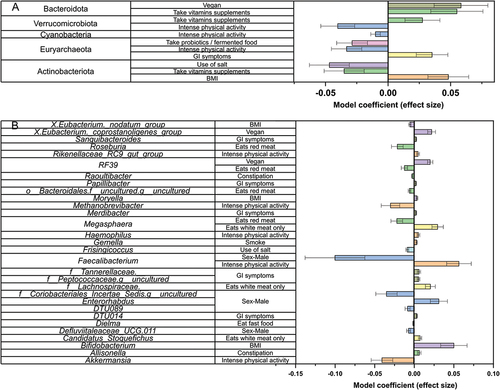
Figure 4. Functional characterization of the gut microbiome of Paraguayans based on PICRUSt2Citation22 analysis of 16S rRNA data. The 27% most abundant across samples are shown.
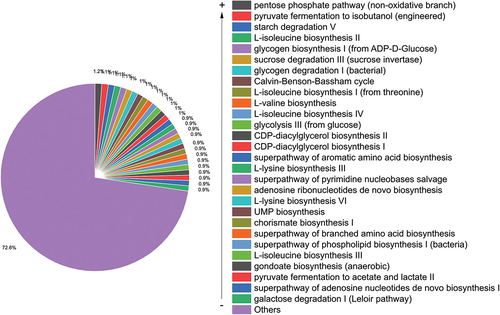
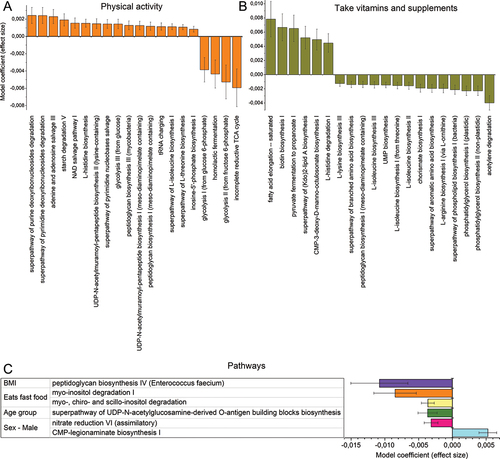
Figure 5. Significant associations identified via multivariate associations with linear models as implemented by MaAsLin2 R-packageCitation19 (FDR < 0.25), between the gut microbiota functional potential (i.e., PICRUSt2 data) and the diet, habits, and clinical history of the Paraguayan cohort. Top 20 pathways associated with physical activities (A), and intake of vitamins and supplements (B), respectively. (C) pathways associated with habits and clinical history. Each association analysis was adjusted for fixed effects according to the data distribution and as previously suggested.Citation20
Supplemental Material
Download PNG Image (97.4 KB)
Supplemental Material
Download MS Excel (11.7 KB)Supplemental Material
Download MS Excel (30.5 KB)Supplemental Material
Download MS Excel (33.2 KB)Supplemental Material
Download MS Excel (282.5 KB)Supplemental Material
Download MS Excel (15.9 KB)Supplemental Material
Download MS Excel (21.2 KB)Supplemental Material
Download PNG Image (607.8 KB)
Supplemental Material
Download PNG Image (332.1 KB)
Supplemental Material
Download PNG Image (495.6 KB)
Supplemental Material
Download PNG Image (495.6 KB)
Data availability statement
Data presented in this study are available online at https://dataview.ncbi.nlm.nih.gov/object/PRJNA992776, accession number PRJNA992776.