
Figures & data
Table 1. List of IPT service quality attributes considered in the study (Kar et al., Citation2022b).
Figure 1. Frequency composition of perceived importance of respondents toward IPT service quality attributes.
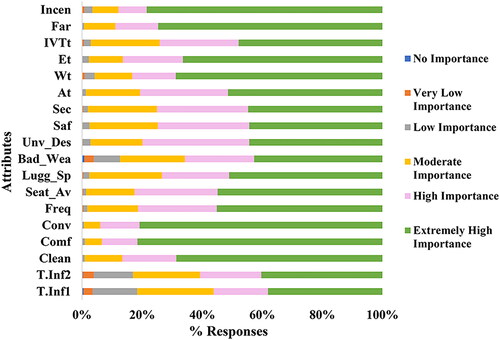
Figure 2. Descriptive statistics of survey respondents.
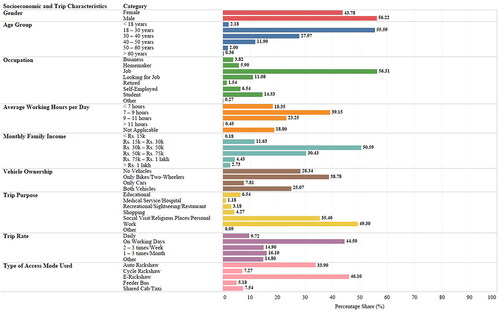
Table 2. Importance-based attribute prioritization using RIDIT.
Table 3. Importance-based attribute importance using GRA.
Table 4. User stated importance-based attribute prioritization using TOPSIS.
Table 5. Results of Spearman’s rank order correlation analysis.
Data availability statement
Some or all data, models, or code generated or used during the study are available from the corresponding author by request.