
Figures & data
Table 1. Factor examined based on the SQ of buses.
Figure 1. Study area map (a) administrative boundary of Nepal, (b) Kathmandu valley area, (c) survey area with bus routes of conventional buses and (d) survey area with bus routes of electric buses.
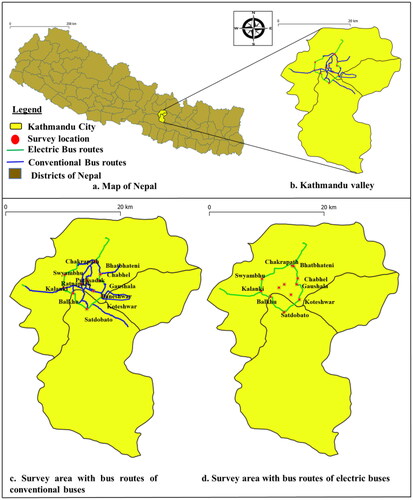
Table 2. Descriptive analyses and performance strength of attributes of service quality (rating of satisfaction).
Figure 2. Overview of socio-demographic and trip characteristics.
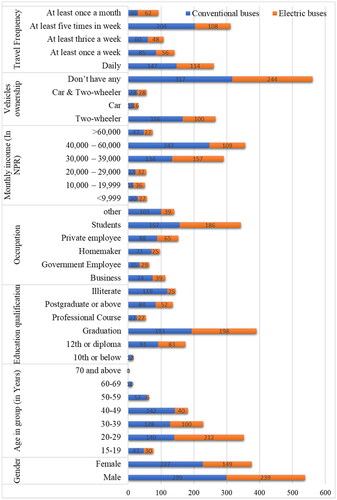
Figure 3. Methodology flow chart: (a) determination of performance strength of attributes; (b) determination of important attributes of SQ by OLR and RF approaches and (c) illustration of three factor theory (TFT).
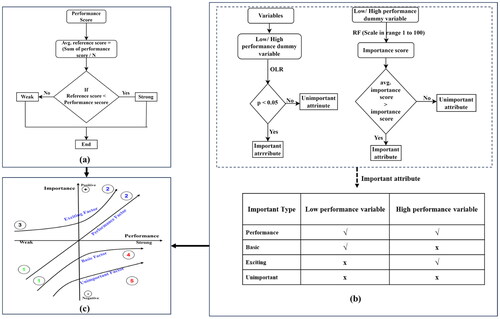
Table 3. Recoding strategies for five-point Likert scale.
Table 4. Ordinal logistic regression results for conventional buses and electric buses.
Figure 4. Random forest results for electric buses.
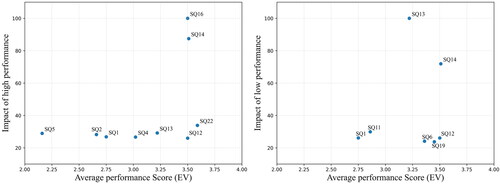
Figure 5. Random forest results for conventional buses.
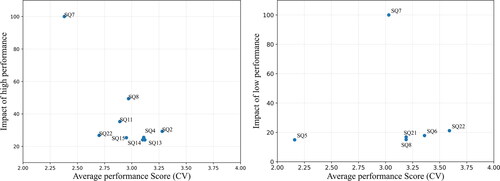
Table 5. Rules for determining the ranking of attributes which affect overall satisfaction.
Table 6. Importance type of each type of service quality attributes.
Table 7. Improvement priority of different service quality attributes.
Table A1. ANOVA test for conventional buses.
Table A2. ANOVA test for electric buses.