
Figures & data
Figure 1. Flow of included studies.
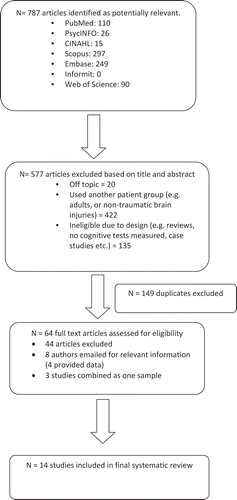
Table 1. Demographic and imaging data.
Table 2. Summary information relating to the cognitive domains and regions of interest assessed in the short and medium to long term.
Table 3. Pearson r effect sizes (moderate-to-large only) measuring the relationship between FA/ADC and cognitive function in specific ROI in the short term (<4 weeks) post-TBI.a
Table 4. Pearson r effect sizes (moderate-to-large only) measuring the relationship between FA and cognitive function in specific ROI in the medium to long term (>4 weeks) post-TBI.a
Table 5. Pearson r effect sizes (moderate-to-large only) measuring the relationship between ADC/MD and cognitive function in specific ROI in the medium to long term (>4 weeks) post-TBI.a
Table A1. Logic grid for PubMed.
Table A2. Logic grid for PsycINFO.
Table A3. Logic grid for Scopus.
Table A4. Logic grid for Embase.
Table A5. Logic grid for Web of Science.
Table A6. Logic grid for CINAHL.
Table A7. Logic grid for Informit (health databases).