
Figures & data
Figure 1. Sample recruitment flow chart for both SGA and AGA preterms
Table 1. Sociodemographic and perinatal characteristics of the SGA and AGA groups
Figure 2. Mean scores for the Bayley scales in the SGA and AGA groups
Note: * p < .001. The dashed line represents the normative mean and the shaded area represents the clinically normal range. Error bars indicate standard error.
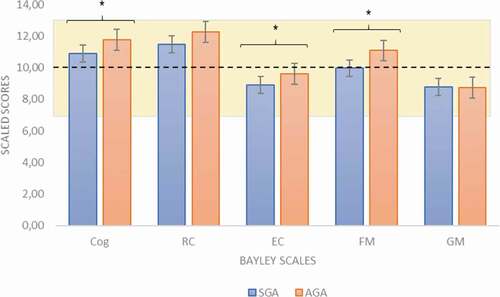
Table 2. Neuropsychological performance of the SGA and AGA groups at Timepoint 2: ANCOVA controlling for maternal education
Table 3. Spearman’s correlations between toddler psychomotor development at 2 years old CA and cognitive and academic functioning at age 6.5 years for the SGA and AGA groups
Supplemental material
Supplemental Material
Download Zip (35.4 KB)Data availability statement
Derived data supporting the findings of this study are available from the corresponding author G.L. on request.