Figures & data
Table 1. Language and cognitive assessment scores for sample
Figure 1. Electrode montage for P1 & N2. The six electrodes analyzed in the component-driven analyses (Section 3.1) are shaded green. The 29 electrodes that contributed to the cluster in the data-driven analyses (Supplemental Materials 1) are surrounded by a dashed line and shaded gray.
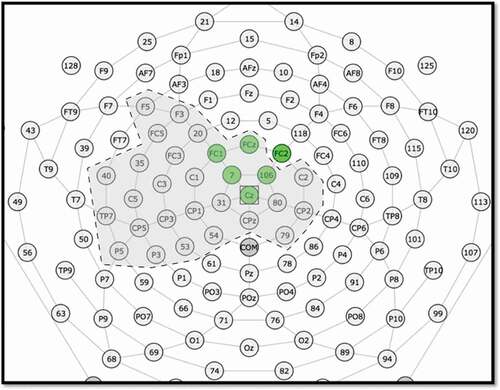
Table 2. Factor pattern for language factor score (LFS)
Table 3. Mean amplitude and latency data for P1 and N2 ERPs for old and new conditions
Figure 2. Grand average ERP waveforms for six-electrode montage for old and new conditions averaged across cluster and within individual electrodes.
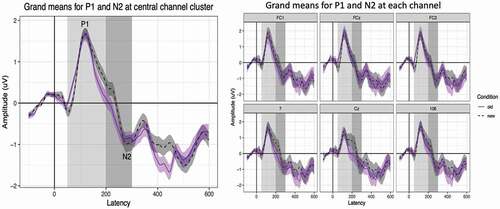
Figure 3. Average ERP waveforms at the six-electrode montage for old and new conditions. Waveforms are binned by LFS quartile for ease of visualization. The time windows used in identifying P1 and N2 peaks for each participant are highlighted in light and dark gray, respectively. Error ribbons = 1 SEM.
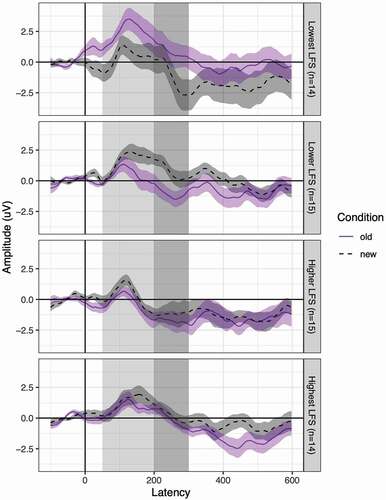
Table 4. Partial correlations among language measures and the P1 and N2 ERP components
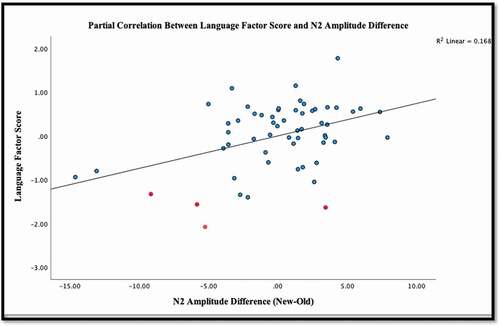
Figure 4. Partial correlations between the language factor score and n2 amplitude difference.