
Figures & data
Table 1. Demographics of participants.
Figure 1. The GGM estimated for the subsamples, on the left (A) is the control group and on the right (B) is the NDC sibling group.
Note: Key: GAD: generalised anxiety disorder; PHQ: depression; SWL: life satisfaction; YEBS-H: hyperactivity/externalising behaviour; YEBS-A: attention difficulties; AQ: autistic traits; FLE: cognitive inflexibility; PAQ: alexithymia; PERS-P: positive emotion reactivity; PERS-N: negative emotion reactivity; ERQ-C: cognitive reappraisal emotion regulation; ERQ-E: expressive suppression emotion regulation; IUS: intolerance of uncertainty; CDR: trait resilience; RSE: self-esteem; AME cognitive empathy; PAC: parent-child communication quality.
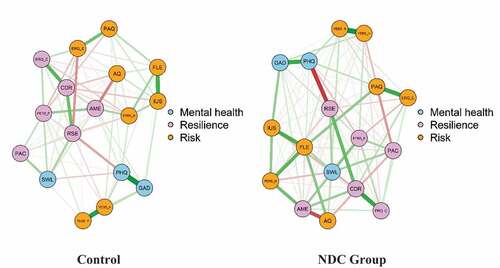
Figure 2. Measures of centrality for the GGMs estimated for the subsamples, on the left (A) is the control group and on the right (B) is the NDC sibling group.
Note. The x-axis depicts z-scores, rather than raw centrality indices.
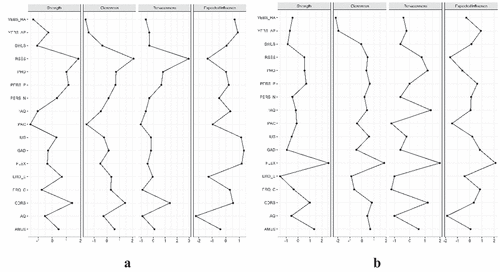
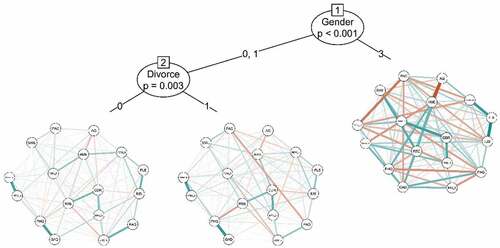
Figure 3. Network tree estimated for demographic predictor variables.
Supplemental material
Supplemental Material
Download MS Word (411.2 KB)Data availability statement
The analytic code and participant data necessary to reproduce the analyses presented are available on the first author’s OSF page: https://osf.io/6w7ar/