
Figures & data
Figure 1. Flowchart of study selection process.
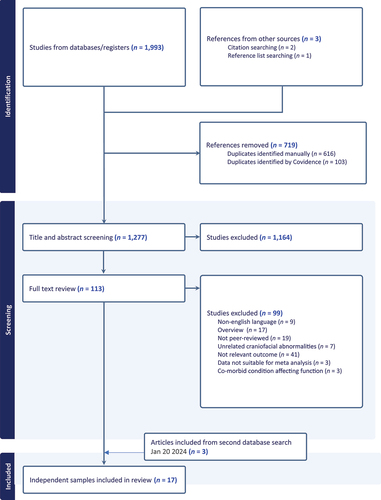
Table 1. Summary demographic characteristics of participants (17 independent studies) at baseline.
Figure 2. Prevalence rates, odds ratios and standardized mean differences of ADHD diagnoses or symptoms associated with ADHD, in children with craniosynostosis, partitioned according to suture type, surgical status and age.
Figure 3. Prevalence rates, odds ratios and standardized mean differences of attention problems or attention functioning, in children with craniosynostosis, partitioned according to type of measure administered.
Figure 4. Standardized mean group differences and prevalence rates for levels of hyperactivity symptoms in children with craniosynostosis.
Supplemental Material
Download MS Word (56.6 KB)Data availability statement
The authors confirm that the data supporting the findings of this meta-analysis are available within its supplementary materials