386
Views
3
CrossRef citations to date
0
Altmetric
Original

ASSESSMENT OF NEWLY DEVELOPED PERFLUOROCARBON EMULSION: OXYGEN CARRYING CAPACITY AS THE BLOOD SUBSTITUTE IN VIVO

, , , , &
Pages 389-397 | Published online: 11 Jul 2009

Figures & data

Figure 1. The concept for High Pressure Process Homogenizer (DeBEE 2000) developed by TalShechter, Nakano, and Fukushima Citation[[6]] employed for PFC emulsification. The first step of PFC emulsification is performed by dual feed method, and the second step by reverse method repeatedly (n = 3−10).

Figure 1. The concept for High Pressure Process Homogenizer (DeBEE 2000) developed by TalShechter, Nakano, and Fukushima Citation[[6]] employed for PFC emulsification. The first step of PFC emulsification is performed by dual feed method, and the second step by reverse method repeatedly (n = 3−10).

Table 1. The Properties of Neo-PFC, Fluosol-DA®, and Stored Blood

Figure 2. The expected solubility of oxygen in circulated blood of the 70%-substituted rats. Each curve was calculated from oxygen dissociation curve of native blood and oxygen solubility of the PFCs. The DO2 presents the amount of oxygen delivered to tissues calculated from PaO2 and PvO2 in normal rats.
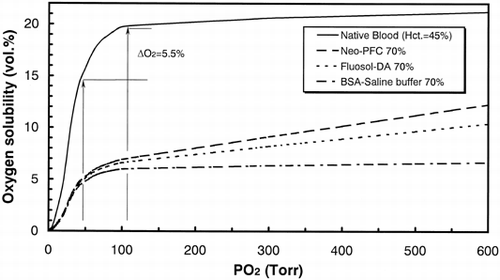
Figure 2. The expected solubility of oxygen in circulated blood of the 70%-substituted rats. Each curve was calculated from oxygen dissociation curve of native blood and oxygen solubility of the PFCs. The DO2 presents the amount of oxygen delivered to tissues calculated from PaO2 and PvO2 in normal rats.

Figure 3. The oxidized states of Cyt. ox. in rat cerebral tissues plotted against the fractional inspired oxygen (FiO2). The error bars mean standard deviations (n = 7). Each percentage value was plotted using those after the exchange transfusion (100% FiO2) as references.
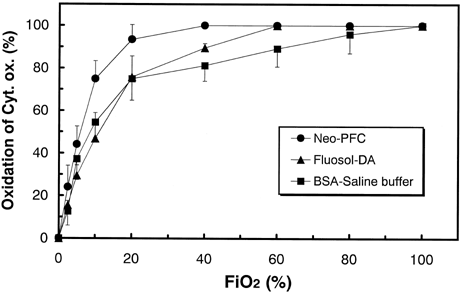
Figure 3. The oxidized states of Cyt. ox. in rat cerebral tissues plotted against the fractional inspired oxygen (FiO2). The error bars mean standard deviations (n = 7). Each percentage value was plotted using those after the exchange transfusion (100% FiO2) as references.

Figure 4. The oxygen partial pressure in arterial and venous blood plotted against FiO2. The error bars mean standard deviations (n = 7). Each concentration was measured from a small amount of blood drawn from a femoral artery and a cervical vein.
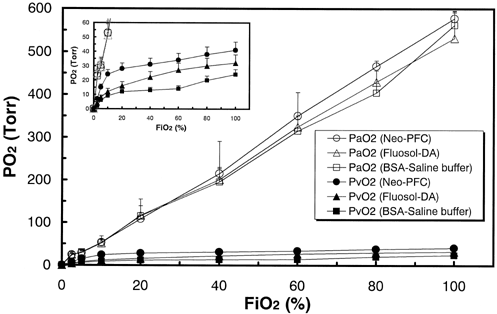
Figure 4. The oxygen partial pressure in arterial and venous blood plotted against FiO2. The error bars mean standard deviations (n = 7). Each concentration was measured from a small amount of blood drawn from a femoral artery and a cervical vein.

Figure 5. The feasible oxygen carrying capacities in three exchange transfusion models calculated from PaO2, PvO2 0(), and oxygen solubility of each blood ().The error bars mean standard deviations (n = 7).
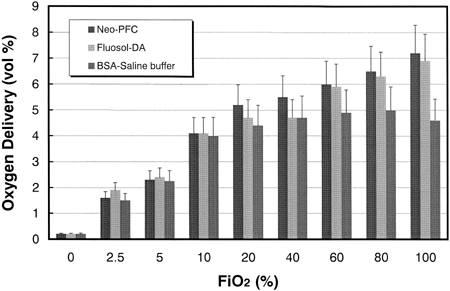
Figure 5. The feasible oxygen carrying capacities in three exchange transfusion models calculated from PaO2, PvO2 0(Figure 4), and oxygen solubility of each blood (Figure 2).The error bars mean standard deviations (n = 7).

Reprints and Corporate Permissions

Please note: Selecting permissions does not provide access to the full text of the article, please see our help page How do I view content?

To request a reprint or corporate permissions for this article, please click on the relevant link below:

Academic Permissions

Please note: Selecting permissions does not provide access to the full text of the article, please see our help page How do I view content?

Obtain permissions instantly via Rightslink by clicking on the button below:

If you are unable to obtain permissions via Rightslink, please complete and submit this Permissions form. For more information, please visit our Permissions help page.