330
Views
11
CrossRef citations to date
0
Altmetric
Original

SELENIUM REDUCES HEMOGLOBIN-INDUCED EPITHELIAL DAMAGE TO INTESTINAL MUCOSA

, Ph.D. & , B.S.
Pages 1-22 | Published online: 11 Jul 2009

Figures & data

Figure 1. Light micrograph of thick section through part of an intestinal villus to show toluidine blue-stained degranulated mast cells (DMC). Empty vacuoles are indicated by arrow heads.
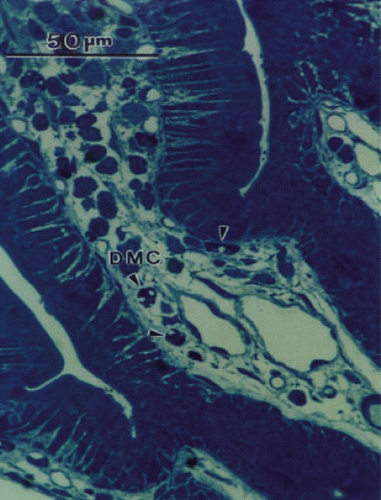
Figure 1. Light micrograph of thick section through part of an intestinal villus to show toluidine blue-stained degranulated mast cells (DMC). Empty vacuoles are indicated by arrow heads.

Figure 2. Histogram showing the number of degranulated mucosal mast cells per villus cross-section in tissue within, and remote from, Peyer's patches after injection of saline or DBBF-Hb in rats fed supplemental selenium or a normal diet.
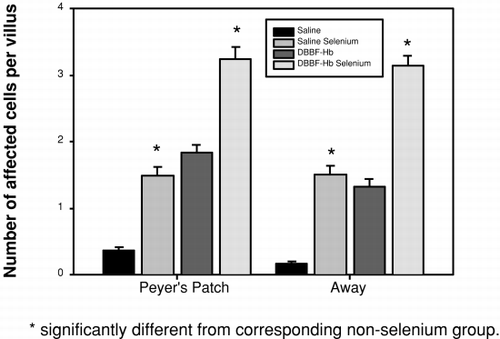
Figure 2. Histogram showing the number of degranulated mucosal mast cells per villus cross-section in tissue within, and remote from, Peyer's patches after injection of saline or DBBF-Hb in rats fed supplemental selenium or a normal diet.
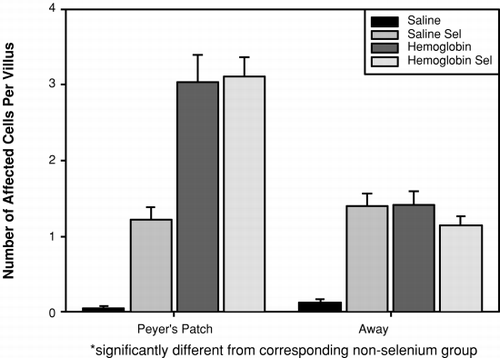
Figure 3. Histogram showing the number of secreting goblet cells per villus cross section in tissue within, and remote from, Peyer's patches after injection of saline or DBBF-Hb in rats fed supplemental selenium or a normal diet.

Figure 3. Histogram showing the number of secreting goblet cells per villus cross section in tissue within, and remote from, Peyer's patches after injection of saline or DBBF-Hb in rats fed supplemental selenium or a normal diet.

Figure 4. Typical electron micrographs of transverse sections through villi from the following groups: (a) rats injected with HBS-BSA and fed a normal diet, (b) rats injected with HBS-BSA and fed selenium supplement, (c) rats injected with DBBF-Hb and fed a normal diet, and (d) rats injected with DBBF-Hb and fed selenium supplement. In (a) and (b), the epithelial cells, E, are intact, adhering closely to the basement membrane and to each other. Sections through mucosal capillaries, C, can be seen. In (c) the epithelial cells are separated from each other and linked only by long, cytoplasmic protuberances. A goblet cell, GC, in the process of secretion can be seen. In (d) the epithelial cells are intact but the mast cells are degranulated (dmc). Magnification: ×6000.
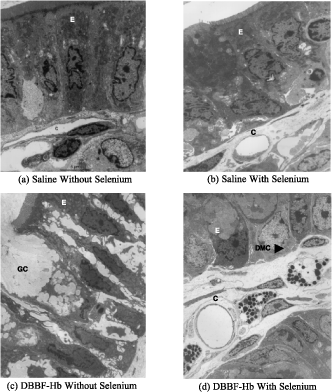
Figure 4. Typical electron micrographs of transverse sections through villi from the following groups: (a) rats injected with HBS-BSA and fed a normal diet, (b) rats injected with HBS-BSA and fed selenium supplement, (c) rats injected with DBBF-Hb and fed a normal diet, and (d) rats injected with DBBF-Hb and fed selenium supplement. In (a) and (b), the epithelial cells, E, are intact, adhering closely to the basement membrane and to each other. Sections through mucosal capillaries, C, can be seen. In (c) the epithelial cells are separated from each other and linked only by long, cytoplasmic protuberances. A goblet cell, GC, in the process of secretion can be seen. In (d) the epithelial cells are intact but the mast cells are degranulated (dmc). Magnification: ×6000.

Figure 5. Histogram to show Epithelial Integrity Index of villi from tissue within, and remote from, Peyer's patches, after injection of saline or DBBF-Hb in rats fed supplemental selenium or a normal diet. The scale ranges from 1 to 3; a score of 1 means intact, and 3 means cels separated from each other and from the basement membrane.
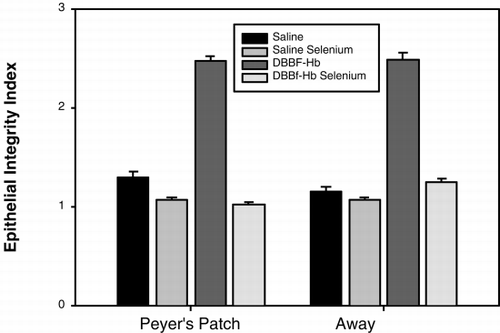
Figure 5. Histogram to show Epithelial Integrity Index of villi from tissue within, and remote from, Peyer's patches, after injection of saline or DBBF-Hb in rats fed supplemental selenium or a normal diet. The scale ranges from 1 to 3; a score of 1 means intact, and 3 means cels separated from each other and from the basement membrane.

Figure 6. Histogram to show fluorescence intensity of dihydrorhodamine 123 in the epithelium of intestinal villi, after injection of saline or DBBF-Hb in rats fed supplemental selenium or a normal diet. On the abscissa the time after injection is plotted in minutes.
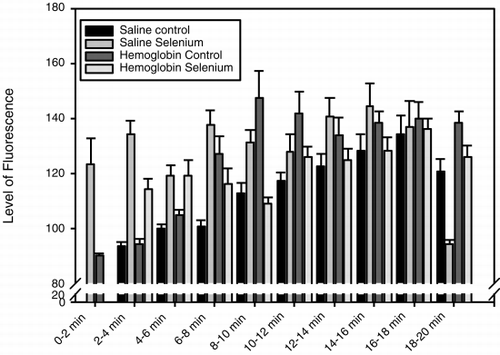
Figure 6. Histogram to show fluorescence intensity of dihydrorhodamine 123 in the epithelium of intestinal villi, after injection of saline or DBBF-Hb in rats fed supplemental selenium or a normal diet. On the abscissa the time after injection is plotted in minutes.

Figure 7. Histogram showing the fluorescence intensity of dihydrorhodamine 123 in the lamina propria of intestinal villi, after injection of saline or DBBF-Hb in rats fed supplemental selenium or a normal diet. On the abscissa is plotted the time after injection in minutes.
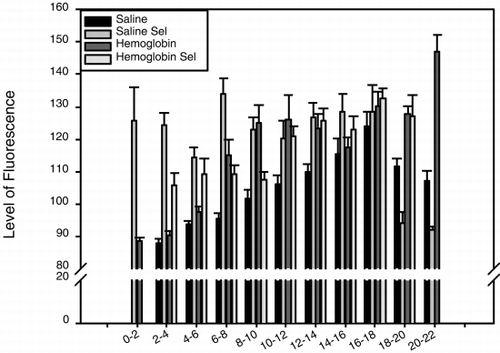
Figure 7. Histogram showing the fluorescence intensity of dihydrorhodamine 123 in the lamina propria of intestinal villi, after injection of saline or DBBF-Hb in rats fed supplemental selenium or a normal diet. On the abscissa is plotted the time after injection in minutes.
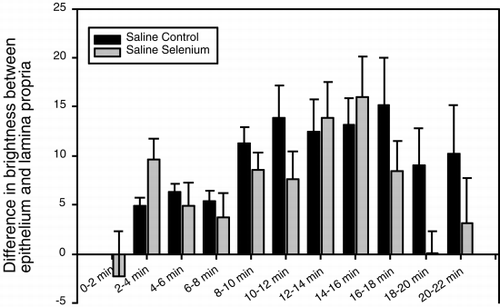
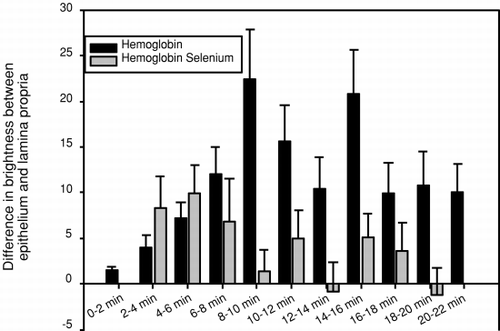
Figure 8. Histogram showing the difference in fluorescence intensity of dihydrorhodamine 123 between the epithelium and lamina propria of intestinal villi, after injection of saline in rats fed supplemental selenium or a normal diet. On the abscissa is plotted the time after injection in minutes.
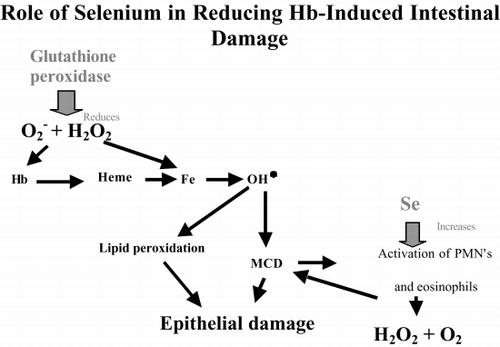
Figure 8. Histogram showing the difference in fluorescence intensity of dihydrorhodamine 123 between the epithelium and lamina propria of intestinal villi, after injection of saline in rats fed supplemental selenium or a normal diet. On the abscissa is plotted the time after injection in minutes.

Figure 9. Histogram showing the difference in fluorescence intensity of dihydrorhodamine 123 between the epithelium and lamina propria of intestinal villi, after injection of DBBF-Hb in rats fed supplemental selenium or a normal diet. On the abscissa is plotted the time after injection in minutes.

Figure 9. Histogram showing the difference in fluorescence intensity of dihydrorhodamine 123 between the epithelium and lamina propria of intestinal villi, after injection of DBBF-Hb in rats fed supplemental selenium or a normal diet. On the abscissa is plotted the time after injection in minutes.

Figure 10. Diagram of the possible roles of selenium in reducing hemoglobin-induced intestinal damage. MCD: mast cell degranulation.

Figure 10. Diagram of the possible roles of selenium in reducing hemoglobin-induced intestinal damage. MCD: mast cell degranulation.

Reprints and Corporate Permissions

Please note: Selecting permissions does not provide access to the full text of the article, please see our help page How do I view content?

To request a reprint or corporate permissions for this article, please click on the relevant link below:

Academic Permissions

Please note: Selecting permissions does not provide access to the full text of the article, please see our help page How do I view content?

Obtain permissions instantly via Rightslink by clicking on the button below:

If you are unable to obtain permissions via Rightslink, please complete and submit this Permissions form. For more information, please visit our Permissions help page.