Figures & data
Figure 1. (Top) Absorbance spectra of myoglobin at differing applied potentials (0.2 V to −0.6 V). Fully oxidized Mb is indicated by the maximum at 408 nm and the fully reduced Mb is indicated by the maximum at 434 nm. Redox measurements were carried out in 100 mM MOPS buffer, pH 7.0, 0.5 mM mediator, and 200 mM NaCl at 20°C. (Bottom) Nernst plot for myoglobin. All potentials were measured against Ag/AgCl reference electrode.
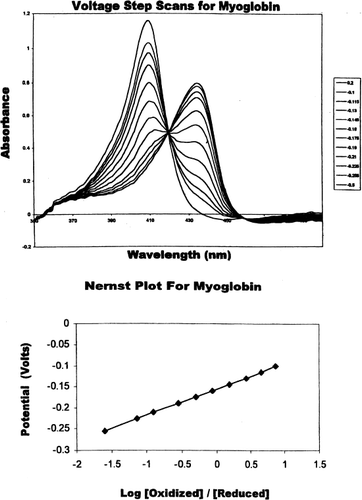
Table 1. Formal Redox Potentials of Hemoglobin-Based Oxygen Carriers by Thin-Layer Spectroelectrochemistry (T=20°C)Footnotea
Figure 2. (Top) Absorbance spectra of Lumbricus hemoglobin at differing potentials (0.2V to −0.6 V). Fully oxidized LtHb is indicated by the maximum at 396 nm and the fully reduced LtHb is indicated by the maximum at 430 nm. Solutions conditions were similar to myoglobin. (Bottom) Nernst plot of Lumbricus hemoglobin. All potentials were measured against Ag/AgCl reference electrode.
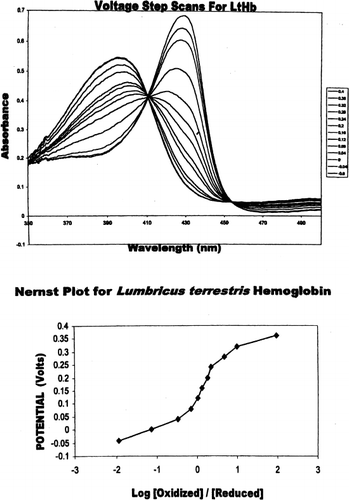
Figure 3. The reduction of the metHb forms of HbXL99α (A) Lumbricus Hb (B), and HbA (C) by 1 mM ascorbic acid at 20°C. Continuous spectra were recorded at specified time intervals (minutes). The rate of appearance of the 540 and 576 nm peaks reflect the conversion of Fe+3-heme→Fe+2-heme for each of hemoglobin sample.
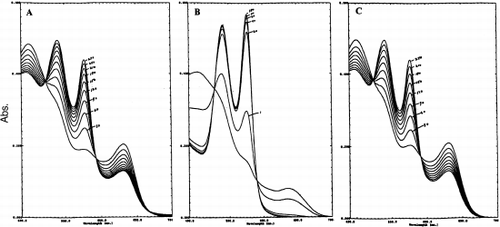
Table 2. Role of Ascorbic Acid in the Reduction (heme-Fe+3→heme-Fe+2) of Hemoglobin-Based Oxygen Carriers at T=20°C, pH 7.0 (% reduction)