Figures & data
Table 1. Amount of Ligand Attached on Carrier vs. Its Adsorption Capacity (The Initial Concentrations of TC, TG, LDL-C, and HDL-C Were 248.6, 167, 183, and 57 mg/dl, Respectively)
Figure 1. Adsorption amount vs. the amount of ligand. The initial concentrations of TC, TG, LDL-C, and HDL-C were 296.7, 167, 183, and 48 mg/dl, respectively.
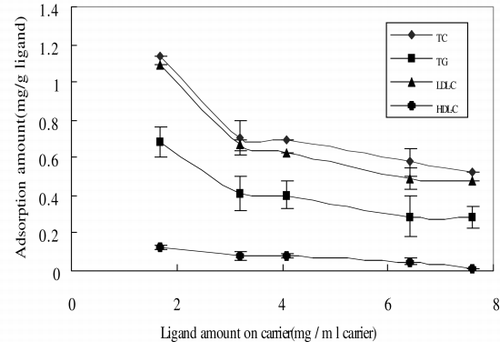
Figure 2. Incubation time vs. adsorption percentage. The initial concentrations of TC, TG, LDL-C, and HDL-C were 296.7, 167, 183, and 48 mg/dl, respectively.
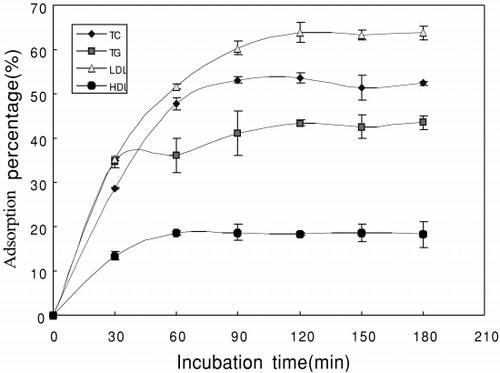
Table 2. Amount of Ligand Attached vs. Nonspecific Adsorption of Adsorbent
Table 3. The Leakage of Ligand After Steam Sterilization
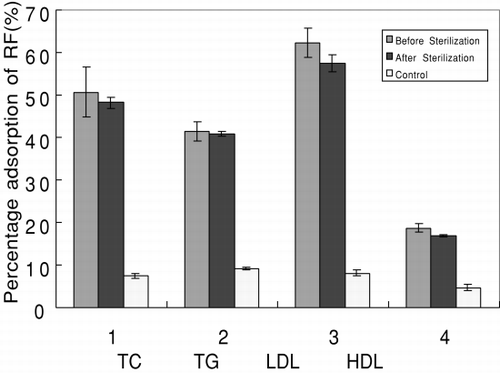
Figure 3. The difference in adsorption capacity of the adsorbent before and after steam sterilization. The initial concentrations of TC, TG, LDL-C, and HDL-C were 234.8, 123, 176, and 47.3 mg/dl, respectively.