743
Views
18
CrossRef citations to date
0
Altmetric
Original

ALBUMIN, BILIRUBIN, AND ACTIVATED CARBON: NEW EDGES OF AN OLD TRIANGLE

, , , , , , & show all
Pages 113-126 | Published online: 11 Jul 2009

Figures & data

Figure 1. First two pictures (A, B) were done in low resolution mode to demonstrate shape parameters of granules of HSGD carbons. Granule in the middle of the first picture was taken for high magnification examination. Three last pictures (C, D, E) are consequent magnification zooms of the same area on the granule. Scale bars are provided in the bottom right corner of each picture. Numbers correspond to the length of the entire scale bars.
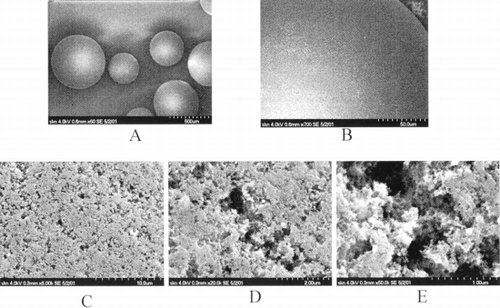
Figure 1. First two pictures (A, B) were done in low resolution mode to demonstrate shape parameters of granules of HSGD carbons. Granule in the middle of the first picture was taken for high magnification examination. Three last pictures (C, D, E) are consequent magnification zooms of the same area on the granule. Scale bars are provided in the bottom right corner of each picture. Numbers correspond to the length of the entire scale bars.

Table 1. Changes in the Concentrations of Nonconjugated Bilirubin and Albumin After 2 Hours of Contact with Activated Carbon in Batch Experiment (Bilirubin–Albumin Solution—6 mL, HSGD—0.05 g; n=5; M±SD)

Figure 2. Melting curves of HSA: (A) defatted HSA; (B) loaded with unconjugated bilirubin up to bilirubin–albumin molecular ratio 0.74; (C) purified onto HSGD carbons up to molecular ratio 0.0024.
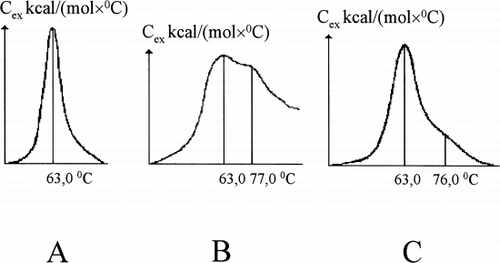
Figure 2. Melting curves of HSA: (A) defatted HSA; (B) loaded with unconjugated bilirubin up to bilirubin–albumin molecular ratio 0.74; (C) purified onto HSGD carbons up to molecular ratio 0.0024.

Table 2. Average Results of 3 Microcolumn Experiments with Albumin-Coated Activated Carbon and Saline Rinsing of 0.5 g HSGD Charcoal (HSA Inlet Concentration—81 g/L, Perfusion Rate—1.25 ml/min)

Figure 3. Average outlet bilirubin concentration curves for uncoated (□) and albumin-coated (•) HSGD carbon.
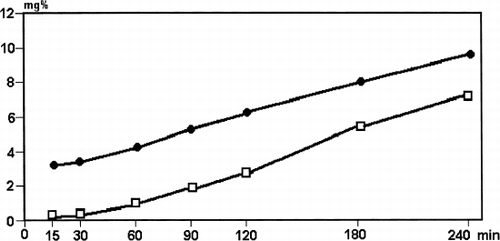
Figure 3. Average outlet bilirubin concentration curves for uncoated (□) and albumin-coated (•) HSGD carbon.

Table 3. Albumin Consumption with Uncoated and Albumin-Coated HSGD Carbon (Average Results from 3 Microcolumn Experiments; HSA Inlet Concentration—34.3 g/L)

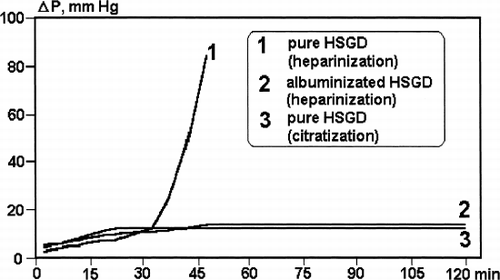
Figure 4. Mean flow resistance (ΔP) of microcolumns during the perfusion with fresh donor blood.

Figure 4. Mean flow resistance (ΔP) of microcolumns during the perfusion with fresh donor blood.

Table 4. Evaluation of Statistical Significance of the Difference in Leukocytes and Thrombocytes Count Between Inlet and Outlet of the Microcolumns HSGD Carbon Perfusing with the Fresh Donor Blood for 120 Min

Figure 5. Melting curves of officinal HSA solution for transfusions before (A) and after (B) its purification onto HSGD carbons in the regimen, similar to the adsorbent coating with albumin. (C) melting curves of defatted HSA, “Sigma,” USA.

Figure 5. Melting curves of officinal HSA solution for transfusions before (A) and after (B) its purification onto HSGD carbons in the regimen, similar to the adsorbent coating with albumin. (C) melting curves of defatted HSA, “Sigma,” USA.

Table 5. Comparation of Flow Microcalorimetry Data (ΔHc, kcal/mole) Reflecting Complex-Forming Abilities of Main Binding Sites of Different Samples of HAS
Reprints and Corporate Permissions

Please note: Selecting permissions does not provide access to the full text of the article, please see our help page How do I view content?

To request a reprint or corporate permissions for this article, please click on the relevant link below:

Academic Permissions

Please note: Selecting permissions does not provide access to the full text of the article, please see our help page How do I view content?

Obtain permissions instantly via Rightslink by clicking on the button below:

If you are unable to obtain permissions via Rightslink, please complete and submit this Permissions form. For more information, please visit our Permissions help page.