Figures & data
Figure 1. Novel strategy to treatment of PKU.
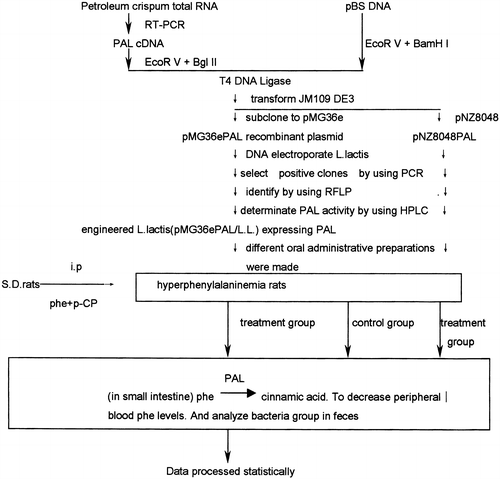
Figure 2. Construction of pMG36e PAL.
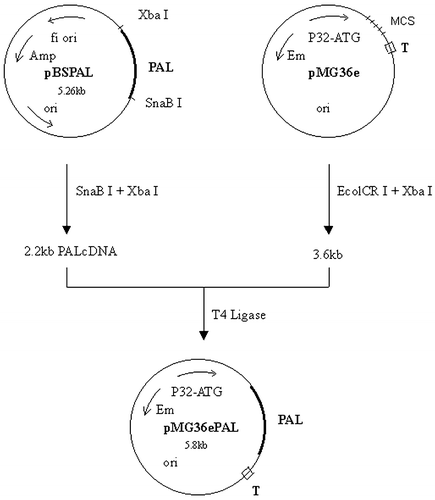
Table 1. The Blood Phe Concentration of All Rats on Different Days During Treatment
Figure 3. PCR products from 8 clones of pMG36eaPAL/L.L. M: λDNA/HidIII digest.
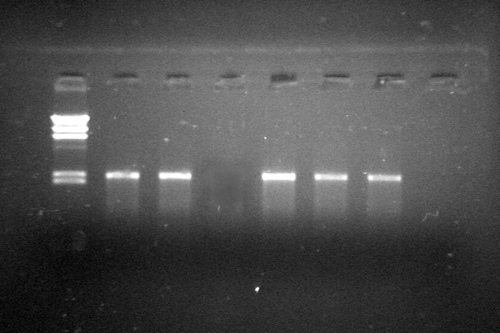
Figure 4.
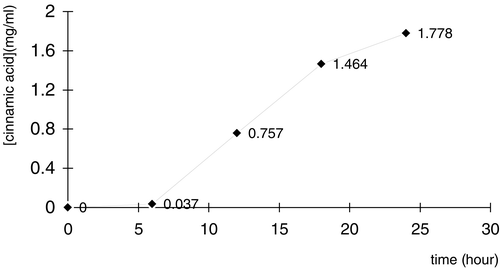
Figure 5. Analysis of PAL specificity in pET23bPAL/JM109DE3 by using HPLC. B1, B2 and B3 were from same clone pET23bPAL/JM109DE3. The only different between them was in culture medium: B1: NZCYM+0.1 mM Phe; B2: NZCYM+0.1 mM tyrosine; B3 NZCYM+0.1 mM Phe+0.1 mM tyrosine. Coumaric acid, the TAL deamination product from tyrosine, was not found in the three culture media above. Only Cinammic acid, the PAL product from Phe, was detected. The result shows: there is no TAL activity in the PAL product of pET23bPAL/JM109DE3, i.e. the specificity of the PAL is ideal.
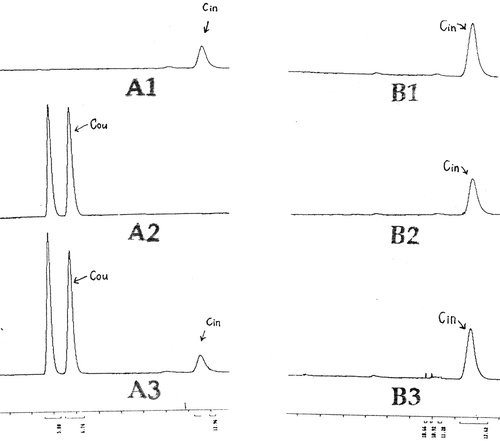
Figure 6. Phe concentration in blood of the hyperphenylalanemia rats treated with two different preparations. *There is a significant difference between treatment group and control group (P<0.05).
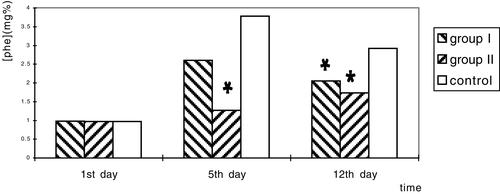
Figure 7. Coomassie blue-stained gels after SDS-PAGE of extracts L.L. containing pNZ(8048-PAL)1 or pNZ(8048-PAL)2 producing PAL protein. Lane 1, molecular weight marker (in kilodaltons); Lane 2, uninduced pNZ(8048-PAL)1/L.L. cells; Lane 3, induced pNZ(8048-PAL)1 cells; Lane 4, uninduced pNZ(8048-PAL)2/L.L. cells; Lane 5, induced pNZ(8048-PAL)2/L.L. cells; Lane 6, uninduced pNZ(8048-PAL)2/L.L. cells; Lane 7, induced pNZ(8048-PAL)2/L.L. cells.
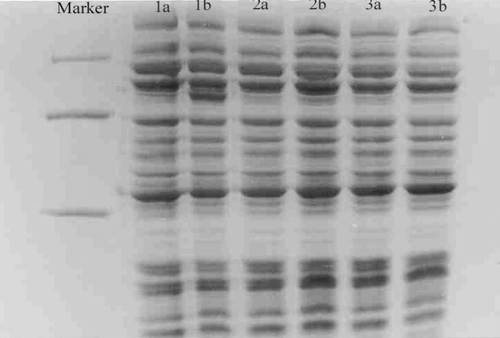
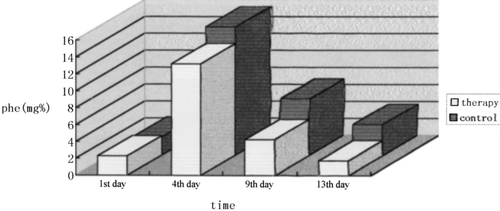
Figure 8. The blood Phe Concentration of each group on different days during treatment. Notes: (1) On the 1st day, blood Phe concentration was similar between two groups. (2) On the 4th day the Phe concentration in the therapy group was slightly lower than control group, but there was no significant difference between two groups. (3) On the 9th day the Phe concentration in the therapy group was distinctly lower than control group. There is significant difference between two groups (P=0.008<0.05). (4) On the 13th day the Phe concentration in the therapy group was 2 times lower than control group. There was extremely significant difference between two groups (P=0.000<0.01). The result shows that feeding engineering L.L. containing PAL gene can reduce the blood Phe concentration of PKU model rats.