Figures & data
Table 1. Clinical and Transfusion Data (Mean±SD)
Table 2. Units PRBC Infused
Table 3. Laboratory Tests Indicative of Renal and Hepatobiliary Function (Mean, [SD])Footnote#
Table 4. Hematological and Coagulation Data (Mean, [SD])
Figure 1. Creatinine clearance before and after transfusion displayed with boxplots and raw data points. Boxplot detail: top and bottom are 75th and 25th percentiles, horizontal line in middle is median, ‘+’ is mean.
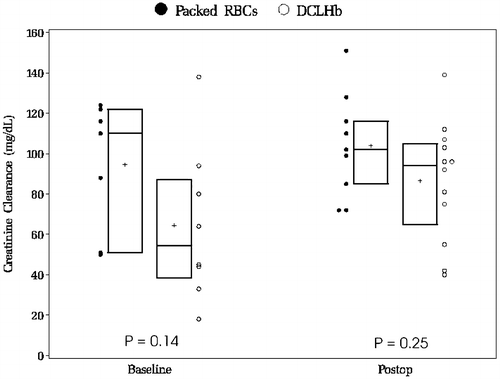
Figure 2. Individual 28-day laboratory profile for each patient in the PRBC and DCLHb groups (A) AST, (B) LDH, (C) amylase. On POD1 data points for amylase are severely reduced because of hemoglobin interference with the assay method. The bold lines represent median values. ULN=upper limit of normal range. Median for DCLHb higher than for PRBC in hours: a) 1–3; b) 1–4; and c) 1–2 (P<0.05 Wilcoxon rank sum tests).
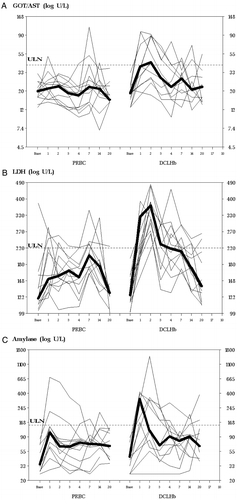
Figure 3. Mean systolic BP (±SD) during the first 72 hours after transfusion of DCLHb or PRBC. Median for DCLHb higher than for PRBC in hours: a) 1–30; b) 1–24; and c) 1–30. (P<0.05 Wilcoxon rank sum tests).
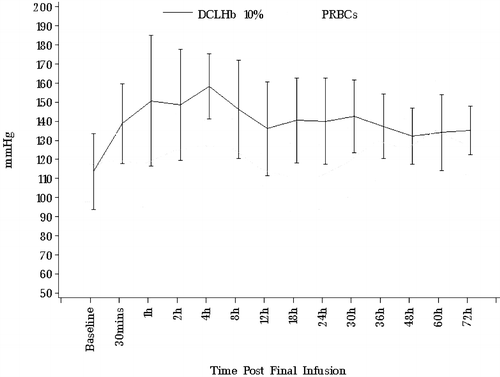
Table 5. Maximum Blood Pressure Increase (mmHg, mean±SD [Median]) within 1 Hour After First Transfusion
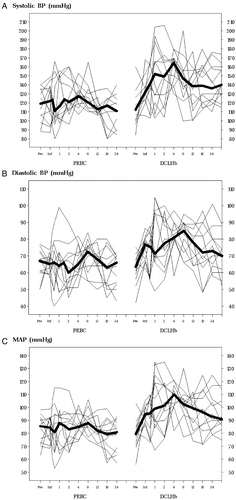
Figure 4. Individual BP profiles during the first 24 hours after transfusion: (A) systolic, (B) diastolic, and (C) MAP. The bold lines represent median values. BP=blood pressure; MAP=mean arterial pressure. Median for DCLHb higher than for PRBC in hours: a) 1–30; b) 1–24; and c) 1–30. (P<0.05 Wilcoxon rank sum tests).