845
Views
25
CrossRef citations to date
0
Altmetric
Original

Encapsulation of Brewers Yeast in Chitosan Coated Carrageenan Microspheres by Emulsification/Thermal Gelation

, &
Pages 275-291 | Published online: 11 Jul 2009

Figures & data

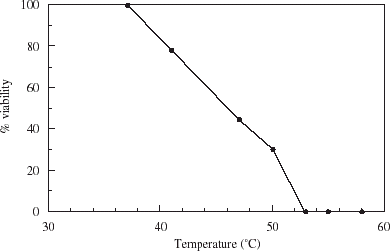
Figure 1. Viability of London yeast incubated for 15 min at increasing temperatures.

Figure 1. Viability of London yeast incubated for 15 min at increasing temperatures.

Figure 2. Gelation temperature of 2 (•) and 3% (▪) carrageenan solutions with different proportions of low gelation temperature carrageenan.
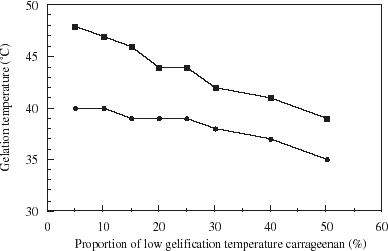
Figure 2. Gelation temperature of 2 (•) and 3% (▪) carrageenan solutions with different proportions of low gelation temperature carrageenan.

Figure 3. Size distribution of yeast-loaded carrageenan microspheres formed by emulsification/thermal gelation.
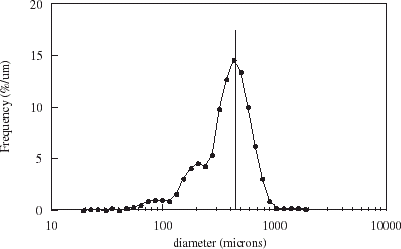
Figure 3. Size distribution of yeast-loaded carrageenan microspheres formed by emulsification/thermal gelation.

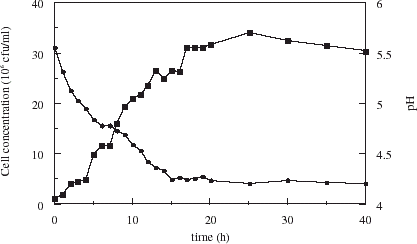
Figure 4. Growth of yeast in brewing medium (▪) and pH profile (•) during free cell culture.

Figure 4. Growth of yeast in brewing medium (▪) and pH profile (•) during free cell culture.

Figure 5. Growth (squares) and pH profile (circles) during fermentation with yeast encapsulated in uncoated (solid symbols) and chitosan-coated (open symbols) carrageenan microspheres.
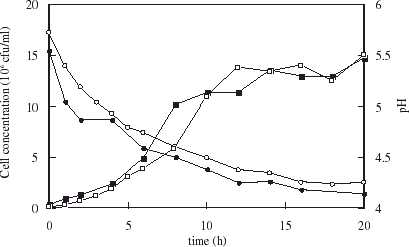
Figure 5. Growth (squares) and pH profile (circles) during fermentation with yeast encapsulated in uncoated (solid symbols) and chitosan-coated (open symbols) carrageenan microspheres.

Figure 6. Free cells (circles) and total cell concentration (squares) over the course of fermentation with yeast-loaded uncoated (open symbols) and chitosan-coated (solid symbols) carrageenan microspheres.
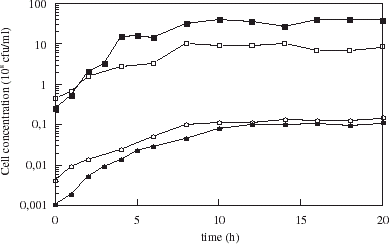
Figure 6. Free cells (circles) and total cell concentration (squares) over the course of fermentation with yeast-loaded uncoated (open symbols) and chitosan-coated (solid symbols) carrageenan microspheres.

Figure 7. Kinetics of free amino nitrogen uptake in fermentations with free cells (•), and cells entrapped in uncoated (▪) and chitosan-coated carrageenan microspheres (▴).
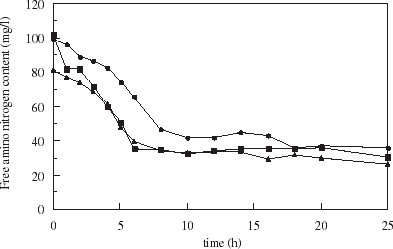
Figure 7. Kinetics of free amino nitrogen uptake in fermentations with free cells (•), and cells entrapped in uncoated (▪) and chitosan-coated carrageenan microspheres (▴).

Table 1. Alcohol and ester content for fermentations with free and carrageenan entrapped cells. Determinations were carried out at the end of fermentation (75 h) and at the end of the maturation process
Reprints and Corporate Permissions

Please note: Selecting permissions does not provide access to the full text of the article, please see our help page How do I view content?

To request a reprint or corporate permissions for this article, please click on the relevant link below:

Academic Permissions

Please note: Selecting permissions does not provide access to the full text of the article, please see our help page How do I view content?

Obtain permissions instantly via Rightslink by clicking on the button below:

If you are unable to obtain permissions via Rightslink, please complete and submit this Permissions form. For more information, please visit our Permissions help page.