Figures & data
Figure 1. Calculation of effectiveness factor for the immobilized enzyme using casein (X) and hemoglobin (▵) as substrates. The effectiveness factor (BA−1) was calculated in terms of expected (A) and expressed activities (B). The expected activity is the difference of total initial activity of trypsin in solution form and the activity in supernatant after precipitation of immobilized enzyme. The activity observed after dissolving the immobilized enzyme is plotted as expressed activity.
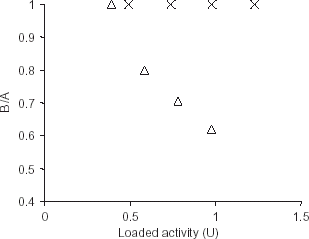
Figure 2. Determination of kinetic constants for the free (○) and immobilized enzyme (•) using casein as substrate. Hanes-Woolf plots for the determination of Km values for free and immobilized trypsin were plotted by measurement of enzyme activity with various concentration of substrate (casein) at 37°C.
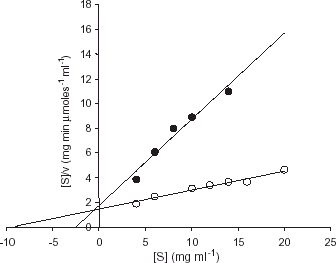
Figure 3. Effect of pH cycling on the activity of enzyme. The activity of the immobilized preparation (•) was assessed by lowering the pH to precipitate the immobilized enzyme, dissolving it again by increasing the pH and assaying it. The initial activities of both free enzyme as well as immobilized enzyme were taken as 100%. Free enzyme (○) was also passed through same pH changes. This cycle was repeated 3 times.
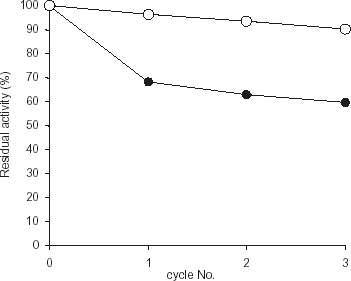
Figure 4. Operational stability of the enzyme preparation. The amount of product released in the supernatant was determined at one hour intervals after removing immobilized enzyme (•) and casein by lowering the pH followed by centrifugation. The activity of the immobilized enzyme was again assessed by adding fresh buffer to the immobilized enzyme and residual casein. The reusability of the free enzyme (○) was assayed in the same way.
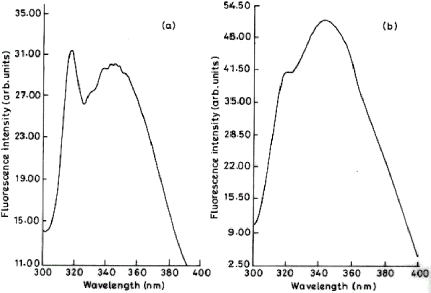
Figure 5. Fluorescence spectra of immobilized trypsin. Emission spectrum was recorded on Shimadzu RF-5000 spectrofluorometer with a band width of 5 nm and 1 cm path length (at an excitation wavelength of 284 nm) for free and immobilized preparation. The amount of protein was same in both the cases. (a) Immobilized trypsin (b) Free trypsin. Control ruled out the quenching activity of the polymer.