240
Views
1
CrossRef citations to date
0
Altmetric
Original

Temporal Effect of Hemoglobin Resuscitation on Sepsis Survival

, &
Pages 401-411 | Published online: 11 Jul 2009

Figures & data

Figure 1. Seven day survival curves of animals resuscitated with HS and subjected to a CLP at various time points (24 h before, 0, 24, and 72 h after HS resuscitation). Animals resuscitated with HS prior to sepsis induction had a significantly higher survival rate than other groups (P < 0.002, Log rank test, N = 5–6 each).
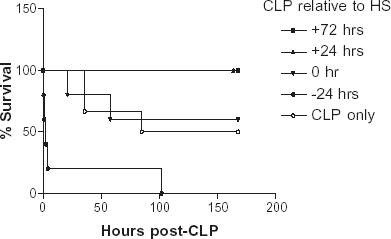
Figure 1. Seven day survival curves of animals resuscitated with HS and subjected to a CLP at various time points (24 h before, 0, 24, and 72 h after HS resuscitation). Animals resuscitated with HS prior to sepsis induction had a significantly higher survival rate than other groups (P < 0.002, Log rank test, N = 5–6 each).

Figure 2. Hepatic HO-1 gene expressions (RT-PCR) of animals 24 h after HS resuscitation prior to sepsis induction. Lane 1: A RT-PCR product from a non-HS resuscitated animal. A 303 base-pair band represents a control gene (glyceraldehyde-6-phosphate dehydrogenase; G6PDH) expression. Lane 2: A RT-PCR product prepared from a HS resuscitated animal. A 1043 base-pair band indicates HO-1 gene expression. Lane 3: A negative control (RT-PCR done without the MuLV reverse transcriptase). Absence of bands indicates no genomic DNA contamination. Lane 4: DNA weight marker (ΦX174RF/HaeIII fragments).
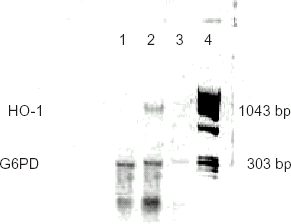
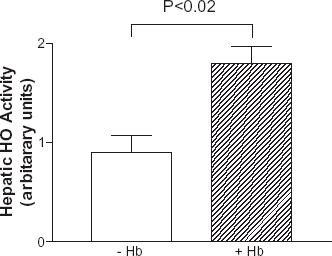
Figure 2. Hepatic HO-1 gene expressions (RT-PCR) of animals 24 h after HS resuscitation prior to sepsis induction. Lane 1: A RT-PCR product from a non-HS resuscitated animal. A 303 base-pair band represents a control gene (glyceraldehyde-6-phosphate dehydrogenase; G6PDH) expression. Lane 2: A RT-PCR product prepared from a HS resuscitated animal. A 1043 base-pair band indicates HO-1 gene expression. Lane 3: A negative control (RT-PCR done without the MuLV reverse transcriptase). Absence of bands indicates no genomic DNA contamination. Lane 4: DNA weight marker (ΦX174RF/HaeIII fragments).

Figure 3. Hepatic HO activity in animals with (+Hb) or without HS (−Hb) resuscitation. HO activity assayed at 24 h after HS resuscitation showed a significantly higher HO activity than that of non-HS resuscitation. (P< 0.02, Student's t-test, N = 3 each).

Figure 3. Hepatic HO activity in animals with (+Hb) or without HS (−Hb) resuscitation. HO activity assayed at 24 h after HS resuscitation showed a significantly higher HO activity than that of non-HS resuscitation. (P< 0.02, Student's t-test, N = 3 each).

Reprints and Corporate Permissions

Please note: Selecting permissions does not provide access to the full text of the article, please see our help page How do I view content?

To request a reprint or corporate permissions for this article, please click on the relevant link below:

Academic Permissions

Please note: Selecting permissions does not provide access to the full text of the article, please see our help page How do I view content?

Obtain permissions instantly via Rightslink by clicking on the button below:

If you are unable to obtain permissions via Rightslink, please complete and submit this Permissions form. For more information, please visit our Permissions help page.