978
Views
8
CrossRef citations to date
0
Altmetric
Original

Determination of the Molecular Weight Distribution of the PEGylated Bovine Hemoglobin (PEG-bHb)

, &
Pages 13-25 | Published online: 11 Jul 2009

Figures & data

Figure 1 HPLC elution profile of BSA. The LS, RI and UV were the signals of laser light-scattering, refractive index and UV absorbance collected with Astra software, respectively.

Figure 1 HPLC elution profile of BSA. The LS, RI and UV were the signals of laser light-scattering, refractive index and UV absorbance collected with Astra software, respectively.

Figure 2 HPLC elution profile of PEG-bHb as the molar ratio of PEG to bHb was 7:1. The LS, RI and UV were the signals of laser light-scattering, refractive index and UV absorbance collected with Astra software, respectively.

Figure 2 HPLC elution profile of PEG-bHb as the molar ratio of PEG to bHb was 7:1. The LS, RI and UV were the signals of laser light-scattering, refractive index and UV absorbance collected with Astra software, respectively.

Figure 3 HPLC elution profile of PEG-bHb as the molar ratio of PEG to bHb was 10:1. The LS, RI and UV were the signals of laser light-scattering, refractive index and UV absorbance collected with Astra software, respectively.

Figure 3 HPLC elution profile of PEG-bHb as the molar ratio of PEG to bHb was 10:1. The LS, RI and UV were the signals of laser light-scattering, refractive index and UV absorbance collected with Astra software, respectively.

Figure 4 HPLC elution profile of PEG-bHb as the molar ratio of PEG to bHb was 13:1. The LS, RI and UV were the signals of laser light-scattering, refractive index and UV absorbance collected with Astra software, respectivley.

Figure 4 HPLC elution profile of PEG-bHb as the molar ratio of PEG to bHb was 13:1. The LS, RI and UV were the signals of laser light-scattering, refractive index and UV absorbance collected with Astra software, respectivley.

Table 1 The average MCP and MP of three different PEG-bHb

Table 2 Relationship between molecular weight and elution time of F1

Table 3 Relationship between molecular weight and elution time of F2

Table 4 Relationship between molecular weight and elution time of F3
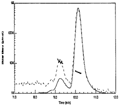
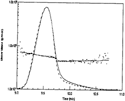
Figure 5 Molecular weight vs elution time of actived mPEG. The dashed lines represent the signal of laser, and the solid lines represent the signal of refractive index.

Figure 5 Molecular weight vs elution time of actived mPEG. The dashed lines represent the signal of laser, and the solid lines represent the signal of refractive index.

Figure 6 Molecular weight vs elution time of native bovine hemoglobin. The dashed lines represent the signal of laser, and the solid lines represent the signal of refractive index.

Figure 6 Molecular weight vs elution time of native bovine hemoglobin. The dashed lines represent the signal of laser, and the solid lines represent the signal of refractive index.

Reprints and Corporate Permissions

Please note: Selecting permissions does not provide access to the full text of the article, please see our help page How do I view content?

To request a reprint or corporate permissions for this article, please click on the relevant link below:

Academic Permissions

Please note: Selecting permissions does not provide access to the full text of the article, please see our help page How do I view content?

Obtain permissions instantly via Rightslink by clicking on the button below:

If you are unable to obtain permissions via Rightslink, please complete and submit this Permissions form. For more information, please visit our Permissions help page.