Figures & data
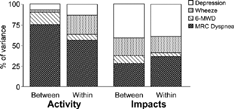
Figure 1. Proportion of variance in SGRQ Activity and Impacts scores (normalised to 100%) derived from multiple regressions against depression score (from the Hospital Anxiety and Depression Scale), presence of daily wheeze (MRC Respiratory Questionnaire), 6-minute walking distance, and MRC Dyspnea score. “Between” indicates comparisons across patients; “Within” indicates longitudinal comparisons within patients.

Figure 2. Frequency distribution of Standard Error of Estimate and half of one Standard Deviation of baseline SGRQ scores from 11 published studies Citation[[1]],Citation[[3]]Citation[5-7]Citation[15&16]Citation[19&20].
![Figure 2. Frequency distribution of Standard Error of Estimate and half of one Standard Deviation of baseline SGRQ scores from 11 published studies Citation[[1]],Citation[[3]]Citation[5-7]Citation[15&16]Citation[19&20].](/cms/asset/f3f03cbf-0a07-4fdf-95c7-295ab45ae73e/icop_a_50513_uf0002_b.gif)
Figure 3. Effect of treatment on SGRQ score in three placebo controlled trials of long-acting bronchodilators: salmeterol Citation[[1]], formoterol Citation[[19]], and tiotropium Citation[[2]]. Lower score indicates better health. Error bars are 95% Confidence Intervals.
![Figure 3. Effect of treatment on SGRQ score in three placebo controlled trials of long-acting bronchodilators: salmeterol Citation[[1]], formoterol Citation[[19]], and tiotropium Citation[[2]]. Lower score indicates better health. Error bars are 95% Confidence Intervals.](/cms/asset/f4b83432-cd93-4a8b-b577-0e3eab2b27e5/icop_a_50513_uf0003_b.gif)
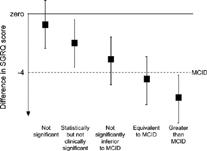
Figure 4. A suggested taxonomy for changes in SGRQ score relative to the minimum clinically important difference (MCID). Lower score indicates better health. Error bars indicate 95% Confidence Intervals.

