Figures & data
Figure 1 Diamagnetic susceptibility versus temperature of pure bismuth heated (dotted line) and solidified in a 5 T inhomogeneous magnetic field (solid line). A large variation of the susceptibility is measured between the solid and the liquid. The higher susceptibility measured after solidification is due to the alignment of crystallites in the magnetic field. These results are extracted from [Citation2].
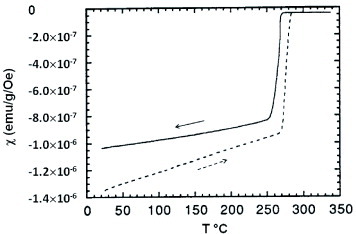
Figure 2 Magnetic susceptibility versus temperature of a Ce–Ni sample. The dotted line corresponds to the heating of a zero-field-solidified sample. The higher susceptibility measured after solidification (solid line) is due to the alignment of crystallites with their easy magnetization axis parallel to the applied field. These results are extracted from [Citation2].
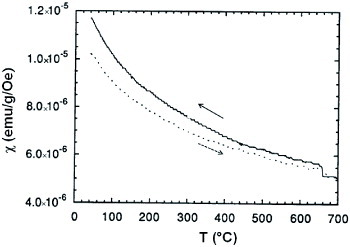
Figure 3 Susceptibility of Dy3 Al2 measured in an inhomogeneous magnetic field of 2.9 T versus the temperature. The solid line corresponds to the heating of a non-oriented sample. The higher susceptibility measured after solidification (dotted line) is due to the alignment of crystallites with their easy magnetization axis parallel to the applied field. An overheating of 8 ° C has been applied after the sample fusion. These results are extracted from the PhD thesis of B Legrand (1996) and from her diploma report (1992).
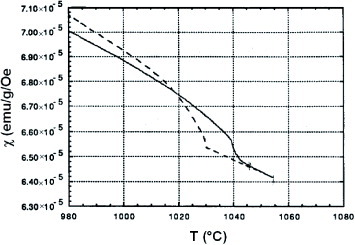
Figure 4 Magnetic susceptibility of Dy3 Al2 measured in an inhomogeneous magnetic field of 2.9 T versus the temperature. The solid line corresponds to the heating of a non-oriented sample. The susceptibility measured after solidification (dotted line) is not higher because there is no alignment of crystallites in the applied field. An overheating of 27 ° C has been applied after the sample fusion. These results are extracted from the PhD thesis of B Legrand (1996) and from her diploma report (1992).
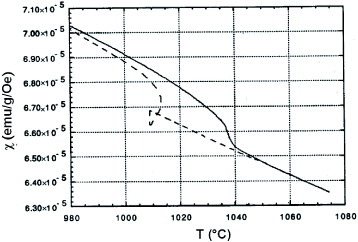
Figure 5 Susceptibility of Sm2 Co17 type alloy having a permanent magnet composition Sm(Co0.65 Fe0.25 Cu0,08 Zr0,02 )8,35 plotted versus temperature. The solid line corresponds to the inductive heating of a non-oriented sample. The higher susceptibility measured after solidification (dotted line) is due to the alignment of crystallites with their easy magnetization axis parallel to the applied field. An overheating of 15 ° C was applied after the sample fusion. These results are extracted from the PhD thesis of B Legrand (1996).
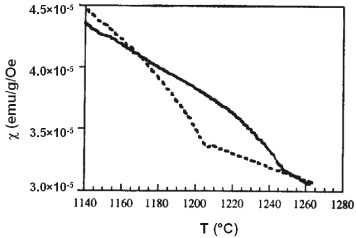
Figure 6 Susceptibility of Nd2 Fe14 B is plotted versus the temperature. The solid line corresponds to the inductive heating of a non-oriented sample. The susceptibility measured during solidification (dotted line) after applying a small overheating of about 3 ° C above the peritectic temperature corresponds to an isothermal solidification. The temperature difference between melting and solidification is due to thermometry problems. This figure is extracted from the PhD thesis of P Courtois (1995).
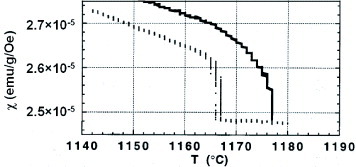
Figure 7 Susceptibility of Nd2 Fe14 B is plotted versus temperature. The dotted line corresponds to the inductive heating of a non-oriented sample. The susceptibility measured during solidification (solid line) after applying a large overheating of about 90 ° C above the peritectic temperature corresponds to abrupt solidification accompanied by recalescence due to undercooling. This figure is extracted from the PhD thesis of P Courtois (1995).
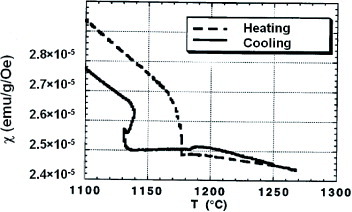
Figure 8 Susceptibility of superalloy AM1 is plotted versus temperature during the heating and cooling cycle; there is no correction associated with the sample holder. The susceptibilities of the solid and then of the dendrites is smaller than that of the melt. This figure is extracted from the PhD thesis of S Rakotoarison (1995).
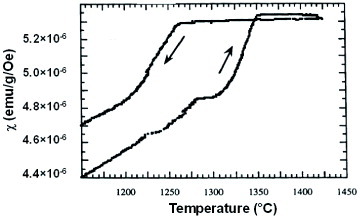
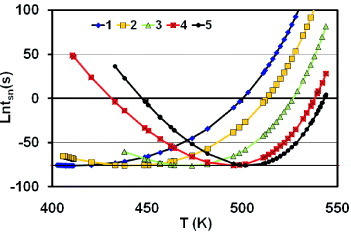
Figure 9 Steady-state first-crystallization time tsn plotted in a logarithmic scale versus temperature. The minimum value of lntsn is equal to - 76.2 regardless of the radius Rnm of the unmelted crystal. The crystallization occurs from an intrinsic nucleus by cooling after tsn = 200 s, where lntsn = ln(200) = 5.3. The curves are numbered from left to right: (1) Rnm = 1.25 nm, the undercooling is ΔT = 41 K; (2) Rnm = 1.4 nm, Δ T = 29 K; (3) Rnm = 1.6 nm, Δ T = 15 K; (4) Rnm = 1.8 nm, Δ T = 4.3 K; (5) Rnm = 1.9 nm, Δ T = 0. The critical radius at T = Tm is equal to 2.5 nm from table 2 in [Citation4].