Figures & data
Figure 1 Schematic diagram (a) and overall view (b) of the high-temperature, high-field x-ray diffraction system.
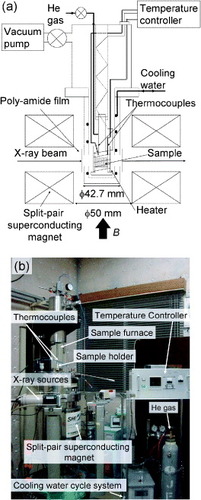
Figure 2 Time dependence of the sample temperature at 473 K (a) and at 398 K (b).

Figure 3 X-ray diffraction pattern of Si at 473 K in 0 T.
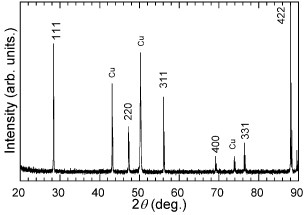
Figure 4 X-ray diffraction patterns of Si at several temperatures in 0 T (a) and 5 (b).
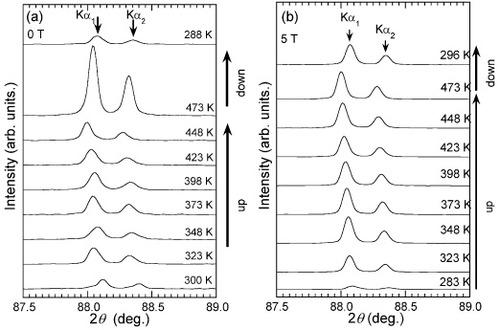
Figure 5 Temperature dependence of the lattice parameter a of Si in 0 T (solid circles) and 5 T (open circles).
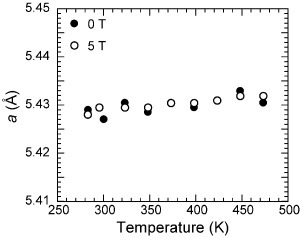
Figure 6 X-ray diffraction patterns of Ni40 Co10 Mn34 Al16 at 283, 398 and 473 K in 0 T. hklt and hklc denote the Miller indices in the tetragonal (martensite phase) and cubic (parent phase) structures, respectively.
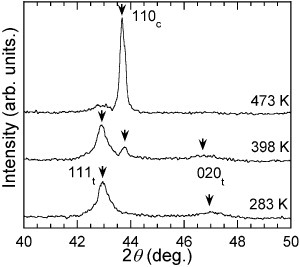
Figure 7 X-ray diffraction patterns of Ni40Co10Mn34Al16 in 0 and 5 T at 408 K. hklt and hklc denote the Miller indices in the tetragonal (martensite phase) and cubic (parent phase) structures, respectively.
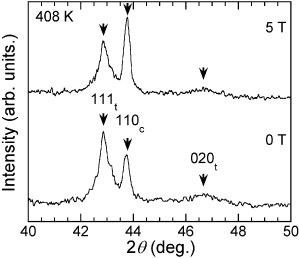
Table 1 Integrated intensities of 111t and 110c reflections in 0 T and 5 T. Integrated intensities are normalized by the intensity of 111t reflection in 0 T.