Figures & data
Figure 1 ORTEP drawing of [Cu(C12H23N3)4Br2·2H2O] with partial atomic numbering.
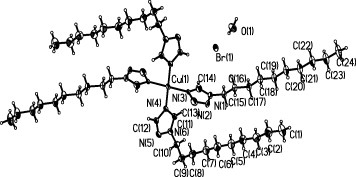
Table 1 Crystal data and structure refinement for the title complex.
Figure 2 CVs of the Cu-CPE in 0.1 M, pH 6.1, B–R buffer solution. Curves (a–e) correspond to the scan rates 0.05, 0.06, 0.07, 0.08 and 0.10 V s−1, respectively. Inset: peak current versus the scan rate.
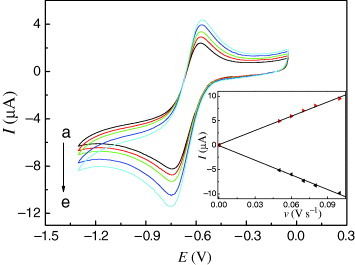
Figure 3 CVs of Cu-CPE in 0.1 M, pH 6.1, B–R buffer solution containing (a–e) 0, 0.2, 0.5, 1.0 and 2.0 μM hydrogen peroxide with the scan rate of 0.08 V s−1. Inset: peak current versus hydrogen peroxide concentration.
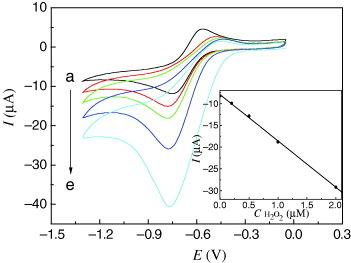
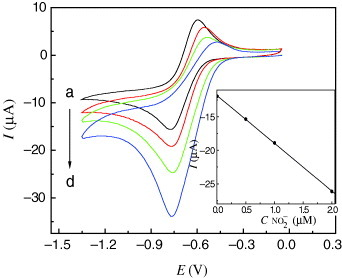
Figure 4 CVs of Cu-CPE in 0.1 M, pH 6.1, B–R buffer solution (a–d) containing 0, 0.5, 1.0 and 2.0 μM nitrite with the scan rate of 0.08 V s−1. Inset: peak current versus nitrite concentration.