Figures & data
Figure 1 Fluorescence images of stained S. epidermidis bacteria grown on ZnO coated glass slides and recorded using confocal laser scanning microscopy (CLSM). The green and red fluorescence, respectively, indicate live and membrane compromised bacteria: (a) ZnO coated control slide, (b) uncoated control slide, (c) UVA exposed ZnO coated slide and (d) UVA exposed uncoated slide (see text of paper for details about UV irradiation conditions). The white length scale bars represent 10 μm for images (a) and (b) and 5 μm for images (c) and (d), respectively.
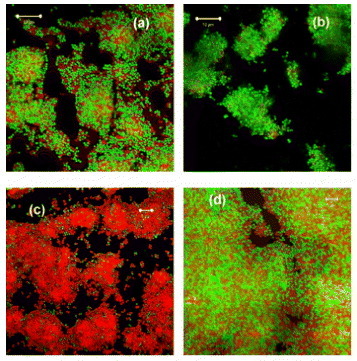
Table 1 Comparison of cell viability (%) of S. epidermidis biofilms grown on ZnO coatings with or without exposure to UVA lamp radiation and P-values from analysis of variance.
Figure 2 SEM images of (a) as-deposited ZnO films and (b) UV irradiated ZnO films after removal of biofilms. The white length scale bars represent 5 μm for both images.
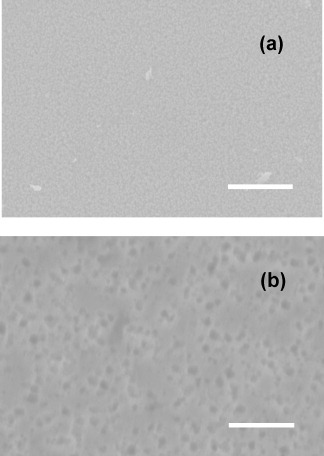
Figure 3 AFM images of (a) as-deposited ZnO films and (b) UV irradiated ZnO films after removal of biofilms. The black open circles point to the characteristic pattern of micron-sized pitting observed after UV treatment (see text for details). Both images represent an area of 5×5 μm2.
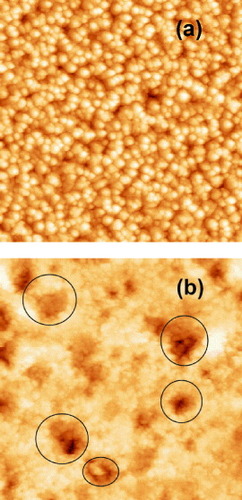
Figure 4 XRD θ−2θ scans of typical as-deposited ZnO films on glass substrates showing they are highly textured with (0002) in-plane orientation.
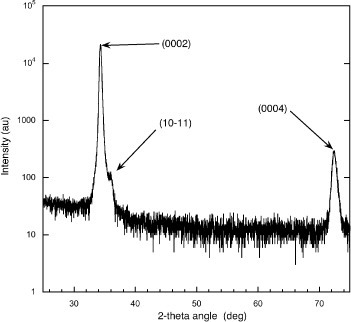
Figure 5 Optical transmission (300–700 nm) spectra of (a) as-deposited and (b) UV treated and cleaned ZnO films.
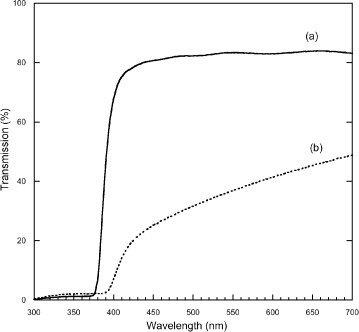
Figure 6 Raman spectra of (a) test ZnO film deposited on a glass substrate and (b) the same ZnO film used for biofilm growth after ultraviolet exposure and cleaning.
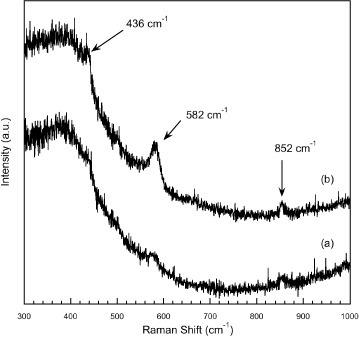
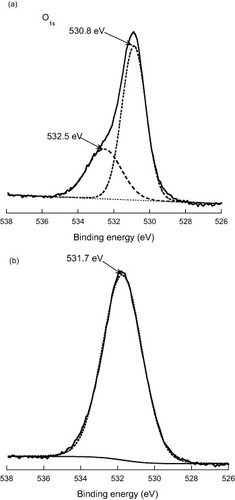
Figure 7 XPS of (a) ZnO reference film and (b) UV exposed ZnO film in the region of the O 1s binding energy (in eV). The spectra are referenced to the C 1s binding energy taken at 285.0 eV.